ACAP-01
Video ad
- Impressions
- 16,018
- Link clicks
- 1,748
- Landing page views
- 1,470
- Attributed conversion events
- 0

Mas National
Digital Campaign Performance Report
ACAP and Mas Allied Health
October established a full calendar month of activity for the new campaign structure, with progress in audience coverage, website traffic and phone-based response. The main Meta campaign reached more people and generated more landing page views overall. LinkedIn image activity attracted additional website clicks, and Allied Health Search continued to generate recorded phone response.
September was a launch period: Meta began on 8 September, ACAP Search and LinkedIn on 4 September, and Allied Health Search on 6 September. October totals therefore cover longer delivery periods. Daily activity and response rates provide context alongside the monthly results and identify where the next improvements can be developed.
ACAP runs across Meta, Google Search and LinkedIn. Mas Allied Health runs across Google Search and LinkedIn. The shared LinkedIn follower campaign supports Mas National across both services and is reported once.
The main Meta campaign recorded 442,080 impressions and reached 152,502 people. Reach grew 10.4% from September while frequency moved from 2.98 to 2.90. The campaign extended its audience coverage while maintaining a similar level of repeat exposure per person.
Landing page views increased 13.7% to 5,908. Across the full October window, the campaign averaged 191 views per day, compared with 226 across September’s 23 active days. Landing page views were equivalent to 89.7% of link clicks, compared with 92.6% in September. These measures establish a full-month reference for developing website response alongside audience growth.
Audience Network contributed 20.5% of impressions, compared with 6.7% in September, and recorded 1,630 landing page views. Its website activity adds useful context to the placement’s exposure contribution. Impressions, reach and page loads remain separate measures; engagement after the page load is the next evidence needed to assess visit quality.
| Region | Impressions | Landing page views | Views per 1,000 impressions |
|---|---|---|---|
| NSW | 99,641 | 1,420 | 14.3 |
| QLD | 97,200 | 1,348 | 13.9 |
| SA | 83,008 | 1,135 | 13.7 |
| ACT | 84,597 | 1,014 | 12.0 |
| TAS | 77,634 | 991 | 12.8 |
New South Wales led both landing page volume and views relative to impressions. Queensland and South Australia also contributed substantial website activity. This provides a regional foundation for reviewing which messages and placements sustain the clearest page-load response.
The campaign continues to fulfil a clear visibility and website-traffic role. Broader reach and additional monthly page loads provide a useful platform for refinement, with daily response and post-click engagement guiding the next assessment of traffic quality.
The website conversion campaign recorded 663 landing page views and five attributed pixel lead events, compared with 575 views and four events in September. Daily views averaged about 21 over October’s full delivery period, compared with 25 in September. The five attributed events provide an initial contact signal across the campaign’s regional activity.
Impressions increased 8.8%, with reach at 37,608 and frequency at 4.48, compared with 44,385 and 3.49 in September. The campaign maintained more repeat contact within its reached audience. One pixel lead event was attributed in each of the five regional ad sets, giving a geographically distributed signal to examine alongside subsequent enquiry information. These remain attributed events rather than a confirmed count of unique enquiries.
The campaign generated website activity and an initial conversion signal across all five regional ad sets. The constructive focus is to use those responses to assess how repeat exposure supports progression towards contact, with enquiry context needed before judging service outcomes.
Remarketing maintained contact with an established audience, reaching 7,708 people on impression volume within 3.1% of September. It recorded 79 landing page views and 147 link clicks, compared with 305 views and 441 clicks in September. Similar audience coverage makes the visit response a specific and measurable area for refinement.
All-ad click-through rate was 1.22%, compared with 2.23%, and frequency was 3.81, compared with 3.97. No pixel lead events were recorded. RMK-16 contributed 40 of the campaign’s 79 landing page views, providing a useful starting point for reviewing the messages and formats that encouraged a return visit. The figures do not establish the cause of the change in response.
The existing audience provides a foundation for improving return-visit response. RMK-16 offers a concrete creative reference for that review, with the relationship between message, visit and subsequent contact remaining the relevant measure of progress.
Audience-building activity continued across the platforms. The Meta campaign recorded 24 attributed Facebook Page likes and 13 Instagram follows, compared with 32 and 12 respectively in September. Its 35,222 impressions reached 14,240 people, with frequency at 2.47. These results show continued audience contact and distinguish the response to each platform’s action.
The shared LinkedIn campaign recorded 48 follows, compared with 42 in September, across an approximate reach of 99,053. Facebook Page likes, Instagram follows and LinkedIn follows are distinct attributed actions, rather than net changes in account followers. Each is assessed separately so its contribution remains clear.
LinkedIn and Instagram recorded additional attributed follows, while Facebook continued to generate Page-like activity. Keeping those actions separate provides a practical basis for refining the message and call to action on each platform as the audience develops.
ACAP Search recorded 1,109 clicks from 8,460 impressions, with click-through rate increasing from 11.53% to 13.11%. Placement also progressed: 80.76% of shown ads appeared at the top of the page, compared with 78.12% in September, and the absolute top-of-page rate was 39.06%, compared with 36.23%. These measures show more prominent ad placement alongside a higher click-through response.
Primary conversion actions totalled about 131: approximately 83 website form actions and 48 calls from ads. September recorded about 167 primary actions. The primary conversion rate was 11.81%, compared with 16.01%, and daily primary actions averaged 4.2 across 31 days, compared with 6.2 across September’s 27 active days. These comparisons identify progression from click to contact as the area to develop alongside the gains in ad engagement.
Search impression share was reported below 10% in both months, so the exact movement in eligible-auction coverage cannot be determined. Placement rates describe ads when they appeared. Lead Submit ALL covers website form events across the site; campaign credit therefore remains distinct from confirmation of an ACAP-specific enquiry. Search terms retain brand and apprenticeship-provider intent, giving the contact review relevant search context.
ACAP LinkedIn recorded 6,051 landing page clicks, compared with 4,967. Image ads contributed 6,042 clicks as approximate reach grew 19.0%. Frequency was 10.34, compared with 7.36, and the image-campaign click rate was 2.57%, compared with 3.35%. The additional traffic provides a substantial set of creative responses to examine as repeat exposure develops.
| Creative | Impressions | Landing page clicks | Ad click rate |
|---|---|---|---|
| ACAP-09 | 82,905 | 1,300 | 1.57% |
| ACAP-11 | 152,232 | 4,742 | 3.11% |
ACAP-11 generated 78.5% of image clicks and achieved about twice the click rate of ACAP-09. This gives the creative review a clear reference after September’s similar rates. The employer guide recorded six document downloads, compared with two. Video recorded 266 impressions and nine landing page clicks; the small delivery volume does not support a general conclusion about video’s potential.
Search progressed in click-through and placement, while LinkedIn extended website traffic and identified a leading image message. The opportunity is to build on these specific strengths and assess how the resulting visits progress into relevant form and phone contact.
Allied Health Search recorded 43 primary conversion actions, compared with 38 in September. Calls from ads increased from 34 to 39, while broad website form actions remained at four. Calls accounted for 90.7% of the total, maintaining a clear phone-led contact pathway.
Clicks increased 17.5% to 181 and click-through rate rose from 6.16% to 7.70%. Top-of-page rate increased from 67.79% to 75.20%, and absolute top-of-page rate from 43.76% to 49.42%. The primary conversion rate was 23.76%, compared with 24.68%, with about 1.4 primary actions per day across October and 1.5 across September’s 25 active days. These measures show additional monthly contact activity alongside progress in ad engagement and placement.
Search impression share was reported below 10% in both months. The improved placement figures are useful evidence of where ads appeared, while the thresholded impression-share result leaves the exact movement in overall eligible-auction coverage unquantified.
Allied Health LinkedIn recorded 4,010 landing page clicks, compared with 3,554. General image activity contributed 2,665 clicks, and the Queensland Lead the Way and BuildHer Up campaign contributed 1,343. The general Allied Health video campaign recorded two clicks from 33 impressions, a small delivery base for assessing that format.
Image-campaign frequency was 16.71, compared with 11.51, with a click-through rate of 2.55%, compared with 2.98%. The Queensland campaign recorded frequency of 9.51 and a 3.18% click rate, compared with 4.29 and 7.09%. Reviewing response as repeat exposure develops will help identify where message refinement or additional creative variation could support continued engagement.
| Creative | Message | Landing page clicks | Ad click rate |
|---|---|---|---|
| MAH-14 | Lead the Way | 1,234 | 4.39% |
| MAH-13 | BuildHer Up | 109 | 0.77% |
Lead the Way generated 91.9% of the Queensland campaign’s landing page clicks, providing a clear message to build on. MAH-06 recorded the highest general image click rate at 2.93%. Business Development, Operations and Community and Social Services featured in the audience response, providing service and referral context to explore alongside actual enquiry information.
Search continued to generate recorded phone response, and LinkedIn added website traffic around identifiable service messages. The practical opportunity is to build on Lead the Way and MAH-06 while assessing how that traffic supports relevant contact and referral activity.
The production website recorded 42,668 page views, up 6.0% from September, and 13,242 user engagement events, up 1.3%. Phone clicks totalled 210, compared with 203, and general click events were 1,814, compared with 1,942. The page-view, engagement and phone results show continued website activity, with individual measures providing distinct views of how visitors interacted.
The regional breakdown gives the contact review a practical geographic basis. These website figures include all traffic sources on masnational.com.au. Event names can overlap, and campaign attribution, tracking consistency and duplicate controls require separate verification. Website events remain separate from the advertising platforms’ conversion totals.
October provides a full-month foundation for developing the new campaign structure. Broader Meta reach, additional LinkedIn traffic and more prominent Search placements give each service specific results to build on. The creative breakdown identifies the messages attracting the clearest click and page-load responses.
The next analytical step is to connect those platform responses with the relevance and progression of actual enquiries. This will help distinguish audience development, website activity and service outcomes, and direct refinement towards the messages and contact pathways that contribute most clearly.
Platform-recorded campaign activity. Website events provide indicative context from all traffic sources. Reach, clicks and conversion measures are distinct and should be read within each campaign.
Campaign: Mas - BA - V2
| Region | Impressions | Reach | All-ad CTR | Link clicks | Landing page views |
|---|---|---|---|---|---|
| SA | 83,008 | 25,182 | 1.51% | 1,281 | 1,135 |
| QLD | 97,200 | 44,974 | 1.61% | 1,471 | 1,348 |
| NSW | 99,641 | 48,502 | 1.65% | 1,552 | 1,420 |
| TAS | 77,634 | 17,956 | 1.50% | 1,160 | 991 |
| ACT | 84,597 | 20,809 | 1.33% | 1,119 | 1,014 |
Reach is not added across regions.
Video ad
Image / carousel ad

Image / carousel ad

Image / carousel ad
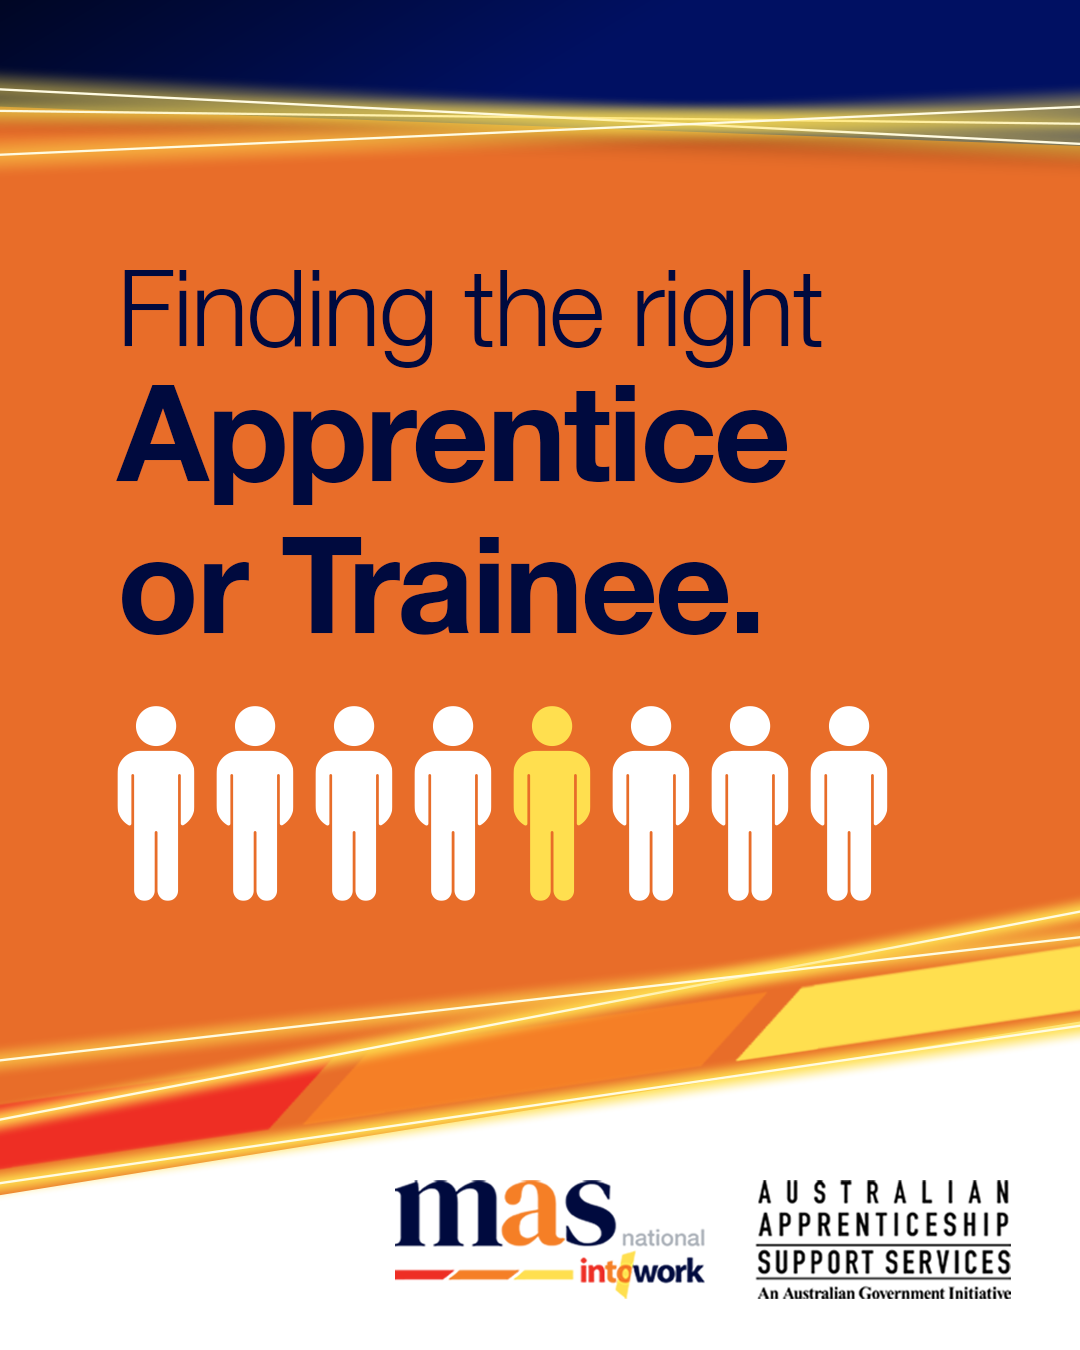
| Creative | Impressions | Link clicks | Landing page views |
|---|---|---|---|
| ACAP-03-NSW | 97,504 | 1,311 | 1,220 |
| ACAP-02-NSW | 35 | 0 | 0 |
| ACAP-01-NSW | 1,506 | 218 | 181 |
| ACAP-04-NSW | 596 | 23 | 19 |
| Creative | Impressions | Link clicks | Landing page views |
|---|---|---|---|
| ACAP-03-QLD | 95,310 | 1,260 | 1,171 |
| ACAP-01-QLD | 1,400 | 197 | 165 |
| ACAP-04-QLD | 438 | 14 | 12 |
| ACAP-02-QLD | 52 | 0 | 0 |
| Creative | Impressions | Link clicks | Landing page views |
|---|---|---|---|
| ACAP-01-SA | 3,730 | 450 | 373 |
| ACAP-02-SA | 27 | 1 | 1 |
| ACAP-03-SA | 79,185 | 829 | 760 |
| ACAP-04-SA | 66 | 1 | 1 |
| Creative | Impressions | Link clicks | Landing page views |
|---|---|---|---|
| ACAP-03-TAS | 71,408 | 620 | 545 |
| ACAP-04-TAS | 82 | 4 | 4 |
| ACAP-01-TAS | 6,137 | 536 | 442 |
| ACAP-02-TAS | 7 | 0 | 0 |
| Creative | Impressions | Link clicks | Landing page views |
|---|---|---|---|
| ACAP-03-ACT | 81,319 | 770 | 702 |
| ACAP-02-ACT | 8 | 0 | 0 |
| ACAP-01-ACT | 3,245 | 347 | 309 |
| ACAP-04-ACT | 25 | 2 | 3 |
Campaign: MAS - C - V2
Meta recorded 5 attributed pixel lead events. These are platform conversion events, not a verified count of unique enquiries.
| Region | Impressions | Reach | All-ad CTR | Link clicks | Landing page views |
|---|---|---|---|---|---|
| NSW | 23,492 | 8,940 | 1.25% | 121 | 102 |
| QLD | 32,616 | 8,411 | 0.98% | 141 | 105 |
| SA | 36,964 | 7,256 | 0.92% | 187 | 147 |
| ACT | 33,423 | 6,347 | 0.74% | 164 | 131 |
| TAS | 41,860 | 7,468 | 0.91% | 223 | 178 |
Reach is not added across regions.
Image / carousel ad

Image / carousel ad
Image / carousel ad
| Creative | Impressions | Link clicks | Landing page views |
|---|---|---|---|
| MAS - C - 05 - NSW | 399 | 3 | 3 |
| MAS - C - 06 - NSW | 23,083 | 118 | 99 |
| MAS - C - 08 - NSW | 10 | 0 | 0 |
| Creative | Impressions | Link clicks | Landing page views |
|---|---|---|---|
| MAS - C - 06 - QLD | 32,336 | 137 | 102 |
| MAS - C - 05 - QLD | 239 | 4 | 3 |
| MAS - C - 08 - QLD | 41 | 0 | 0 |
| Creative | Impressions | Link clicks | Landing page views |
|---|---|---|---|
| MAS - C - 08 - SA | 176 | 0 | 0 |
| MAS - C - 06 - SA | 32,025 | 157 | 118 |
| MAS - C - 05 - SA | 4,763 | 30 | 29 |
| Creative | Impressions | Link clicks | Landing page views |
|---|---|---|---|
| MAS - C - 05 - TAS | 6,156 | 41 | 28 |
| MAS - C - 08 - TAS | 95 | 1 | 2 |
| MAS - C - 06 - TAS | 35,609 | 181 | 148 |
| Creative | Impressions | Link clicks | Landing page views |
|---|---|---|---|
| MAS - C - 08 - ACT | 114 | 1 | 0 |
| MAS - C - 05 - ACT | 5,585 | 35 | 28 |
| MAS - C - 06 - ACT | 27,723 | 128 | 103 |
Campaign: Mas - RMK - V2
| Region | Impressions | Reach | Link clicks |
|---|---|---|---|
| ACT | 1,294 | 355 | 4 |
| NSW | 10,762 | 2,898 | 54 |
| QLD | 8,952 | 2,549 | 43 |
| SA | 4,878 | 1,220 | 33 |
| TAS | 3,494 | 721 | 13 |
Reach is not added across regions.
Video ad
Video ad
Image / carousel ad

| Measure | Facebook and Instagram | LinkedIn shared campaign |
|---|---|---|
| Impressions | 35,222 | 436,451 |
| Reach | 14,240 | 99,053 (approx.) |
| Clicks | 1,486 link/profile clicks | 99 ad clicks |
| All-ad CTR | 5.22% | 0.02% |
| Frequency | 2.47 | 4.41 |
Facebook Page likes, Instagram follows and LinkedIn follows are distinct attributed actions, rather than net follower growth. The shared LinkedIn follower campaign is reported once.
Reach is not added across regions.
Image / carousel ad

Image / carousel ad
| Measure | ACAP employers | Allied Health providers |
|---|---|---|
| Impressions | 8,460 | 2,350 |
| Clicks | 1,109 | 181 |
| Click-through rate | 13.11% | 7.70% |
| Primary website form actions | 83 | 4 |
| Primary calls from ads | 48 | 39 |
| Primary conversion actions | 131 | 43 |
| Primary conversion rate | 11.81% | 23.76% |
Google conversion credit can be fractional and is rounded in headline counts. Lead Submit ALL covers website form events across the site, so campaign attribution does not confirm a form or service identity. ACAP also received 2 secondary Lead Submit MAH actions, excluded from primary totals.
| Search term | Impressions | Clicks | Conversion actions |
|---|---|---|---|
| mas national | 125 | 76 | 18.00 |
| mas apprenticeship | 14 | 12 | 4.00 |
| apprentice connect australia provider | 49 | 14 | 3.00 |
| mas national apprenticeship | 22 | 12 | 3.00 |
| mature age apprenticeship | 80 | 12 | 3.00 |
| megt apprenticeship | 52 | 10 | 3.00 |
| adms support | 7 | 5 | 2.00 |
| how to get a mature age apprenticeship | 7 | 4 | 2.00 |
| mature age apprenticeships | 5 | 2 | 2.00 |
| mas apprentice | 3 | 2 | 2.00 |
| apprenticeship connect provider | 2 | 1 | 2.00 |
| electrician apprenticeship | 121 | 8 | 2.00 |
| apprenticeship connect australia provider | 17 | 10 | 1.00 |
| Search term | Impressions | Clicks | Conversion actions |
|---|---|---|---|
| workforce australia | 333 | 14 | 3.00 |
| mas national apprenticeship | 40 | 16 | 2.00 |
| mas apprenticeships | 25 | 6 | 2.00 |
| workforce australia contact | 17 | 5 | 2.00 |
| mtc marrickville | 10 | 2 | 2.00 |
| etc strathpine | 16 | 2 | 2.00 |
| apm adelaide | 2 | 1 | 2.00 |
| apm chermside | 2 | 1 | 2.00 |
| busy ability north lakes | 5 | 2 | 1.00 |
| wise employment gosford | 5 | 2 | 1.00 |
| megt apprenticeship | 42 | 2 | 1.00 |
| verto bathurst | 3 | 2 | 1.00 |
| etc tuncurry | 2 | 2 | 1.00 |
| Campaign | Impressions | Approx. reach | Ad clicks | CTR | Campaign result |
|---|---|---|---|---|---|
| ACAP | LI | WV | Image | 235,137 | 22,739 | 6,042 | 2.57% | 6,042 landing page clicks |
| ACAP | LI | WV | Video | 266 | 104 | 9 | 3.38% | 9 landing page clicks |
| ACAP | LI | LG | 27,143 | 12,048 | 109 | 0.40% | 6 document downloads |
LinkedIn landing page clicks measure click-throughs, rather than confirmed website loads or enquiries. Reach is reported separately for each campaign and is not added.
Reported ad clicks. Demographic categories may overlap.
Reported ad clicks. Demographic categories may overlap.
Image ad

Image ad
Document ad
Video ad
| Campaign | Impressions | Approx. reach | Ad clicks | CTR | Campaign result |
|---|---|---|---|---|---|
| MAH | LI | WV | Images | 104,435 | 6,249 | 2,665 | 2.55% | 2,665 landing page clicks |
| MAH | LI | WV | Video | 33 | 15 | 2 | 6.06% | 2 landing page clicks |
| MAH | LI | QLD | 42,224 | 4,441 | 1,343 | 3.18% | 1,343 landing page clicks |
LinkedIn landing page clicks measure click-throughs, rather than confirmed website loads or enquiries. Reach is reported separately for each campaign and is not added.
Reported ad clicks. Demographic categories may overlap.
Reported ad clicks. Demographic categories may overlap.
Image ad
Video ad
Image ad
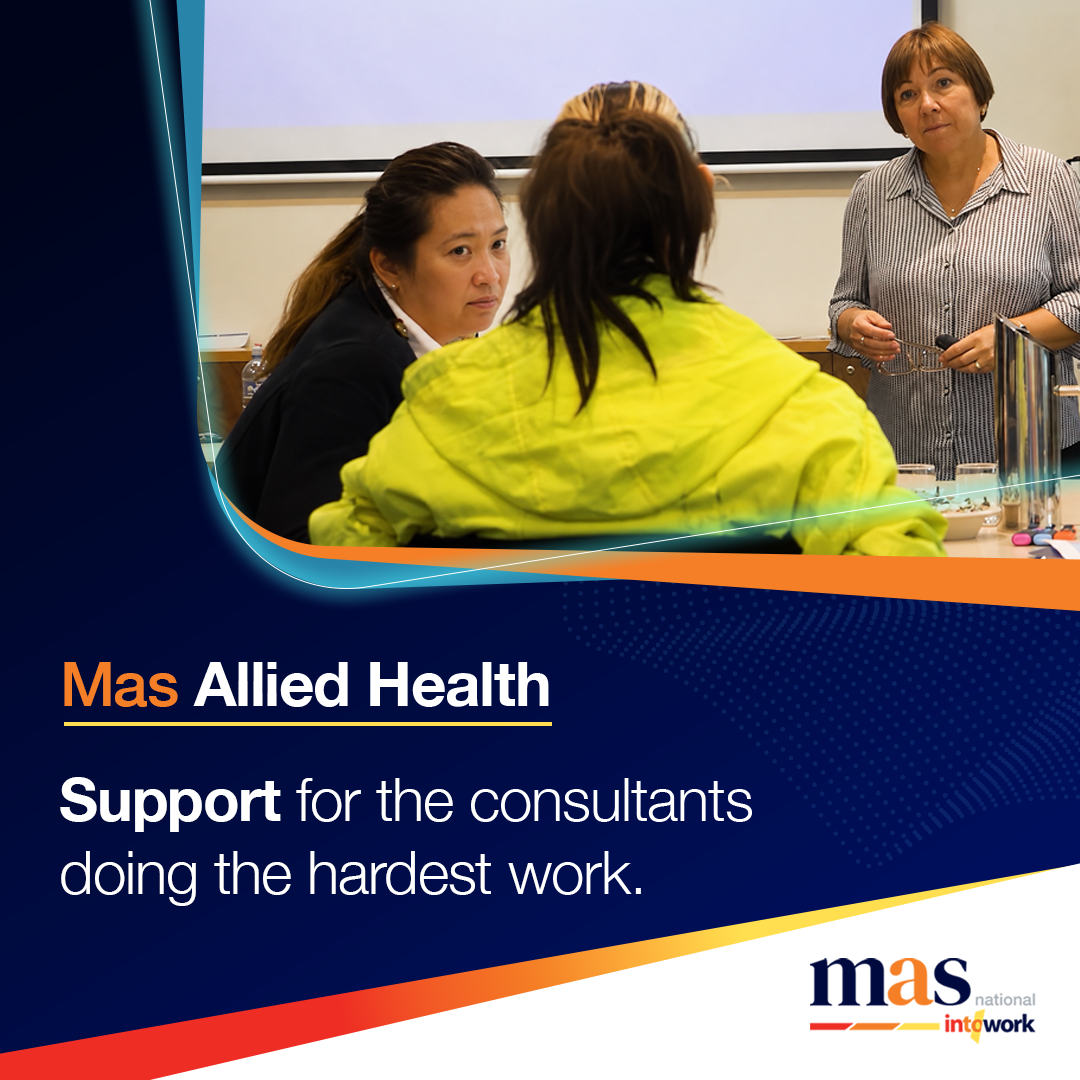
Image ad
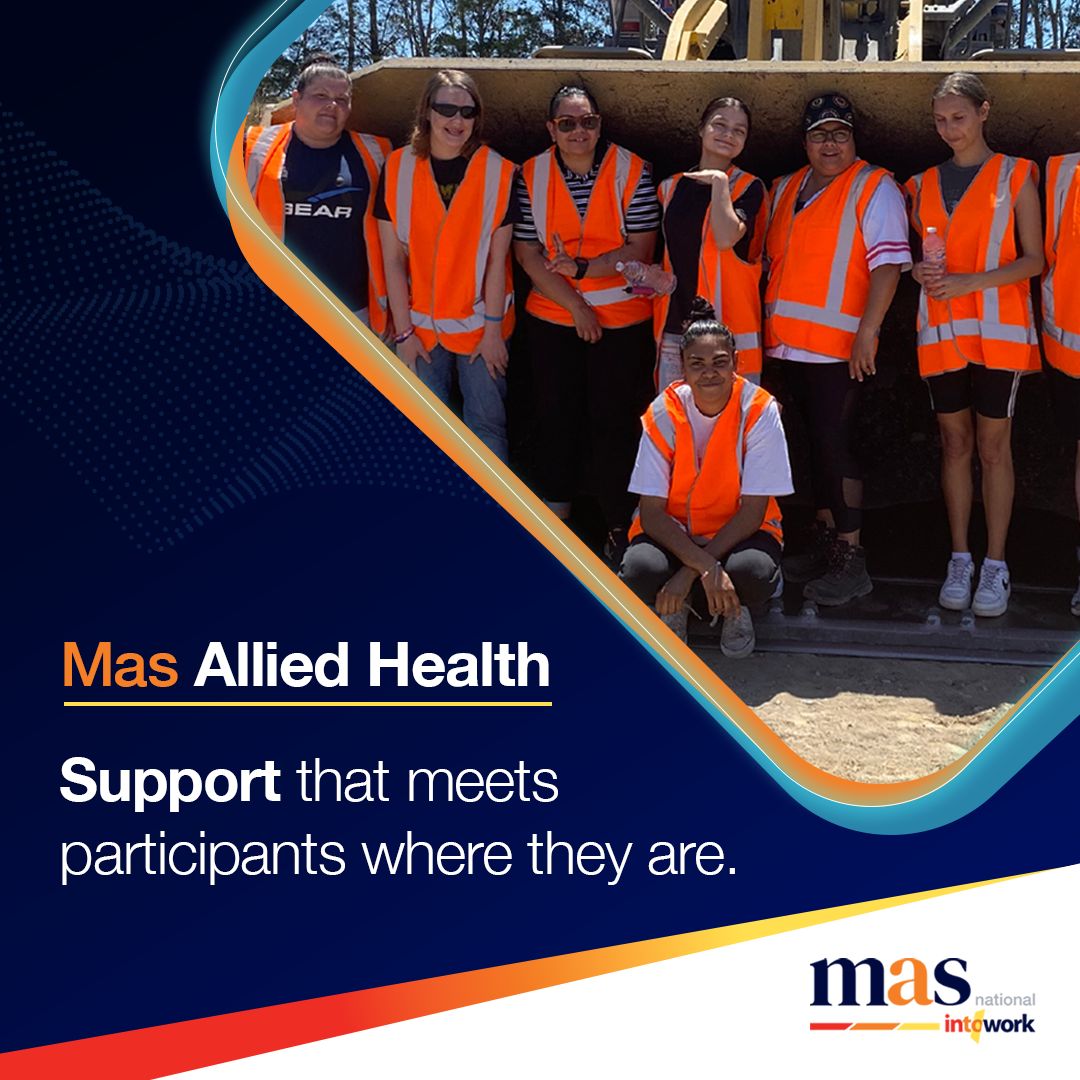
Image ad
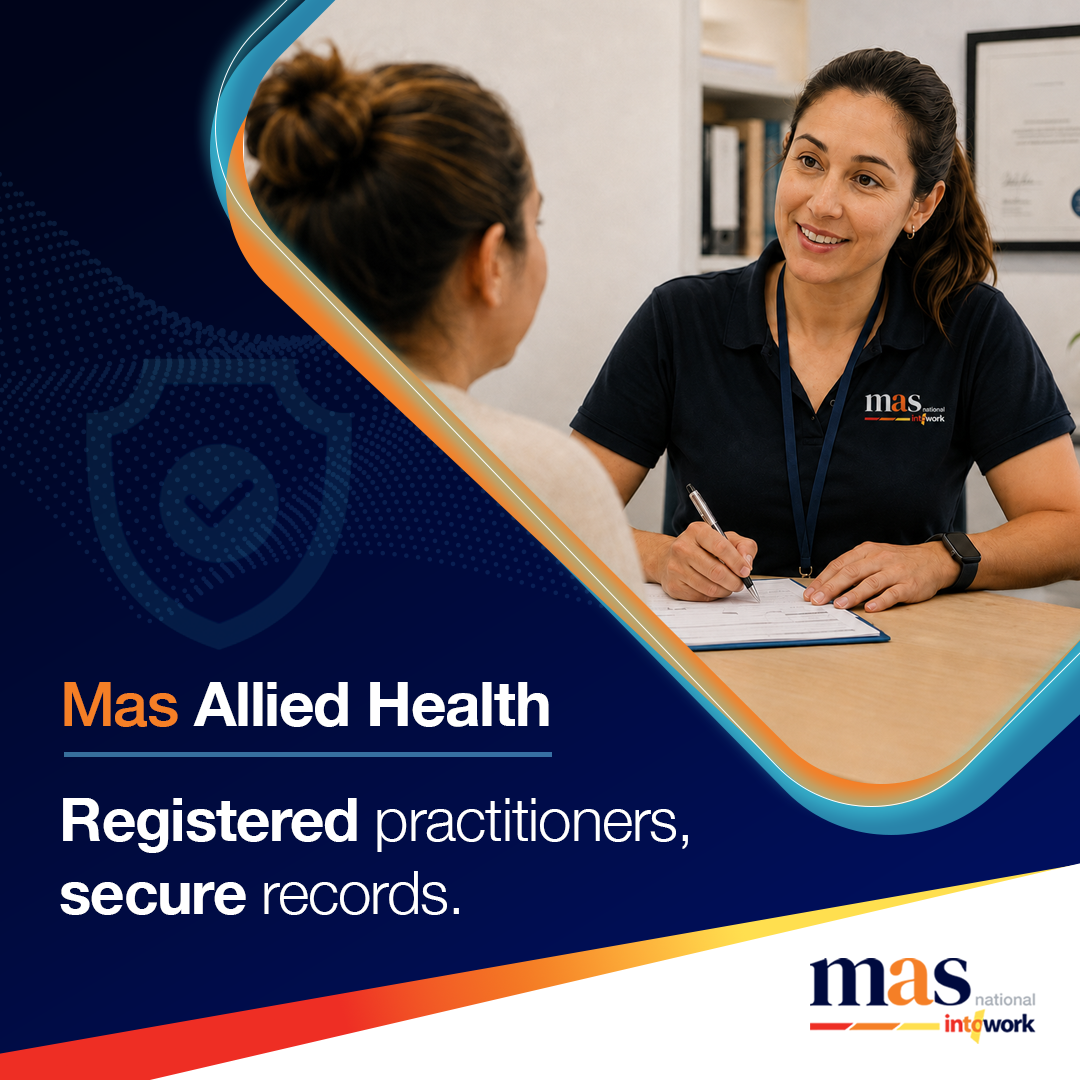
Video ad
Video ad
| Region | Page views | Engagement events | All clicks | Phone clicks | Form submissions |
|---|---|---|---|---|---|
| NSW | 12,326 | 3,985 | 566 | 89 | 86 |
| QLD | 8,926 | 2,883 | 417 | 30 | 63 |
| SA | 5,014 | 1,925 | 394 | 36 | 39 |
| TAS | 1,774 | 656 | 131 | 5 | 15 |
| ACT | 1,445 | 476 | 42 | 2 | 8 |
| Region | Contact Us | Sign Up Apprentice | Sign Up Apprentice Now |
|---|---|---|---|
| NSW | 80 | 4 | 4 |
| QLD | 61 | 1 | 3 |
| SA | 37 | 2 | 0 |
| TAS | 12 | 2 | 4 |
| ACT | 7 | 1 | 0 |
Website events cover all traffic on masnational.com.au. Event names can overlap and are not added to produce a lead total. The five regional rows do not represent all locations in the headline totals. Tracking consistency, duplicate controls and campaign attribution require separate verification.