ACAP-03
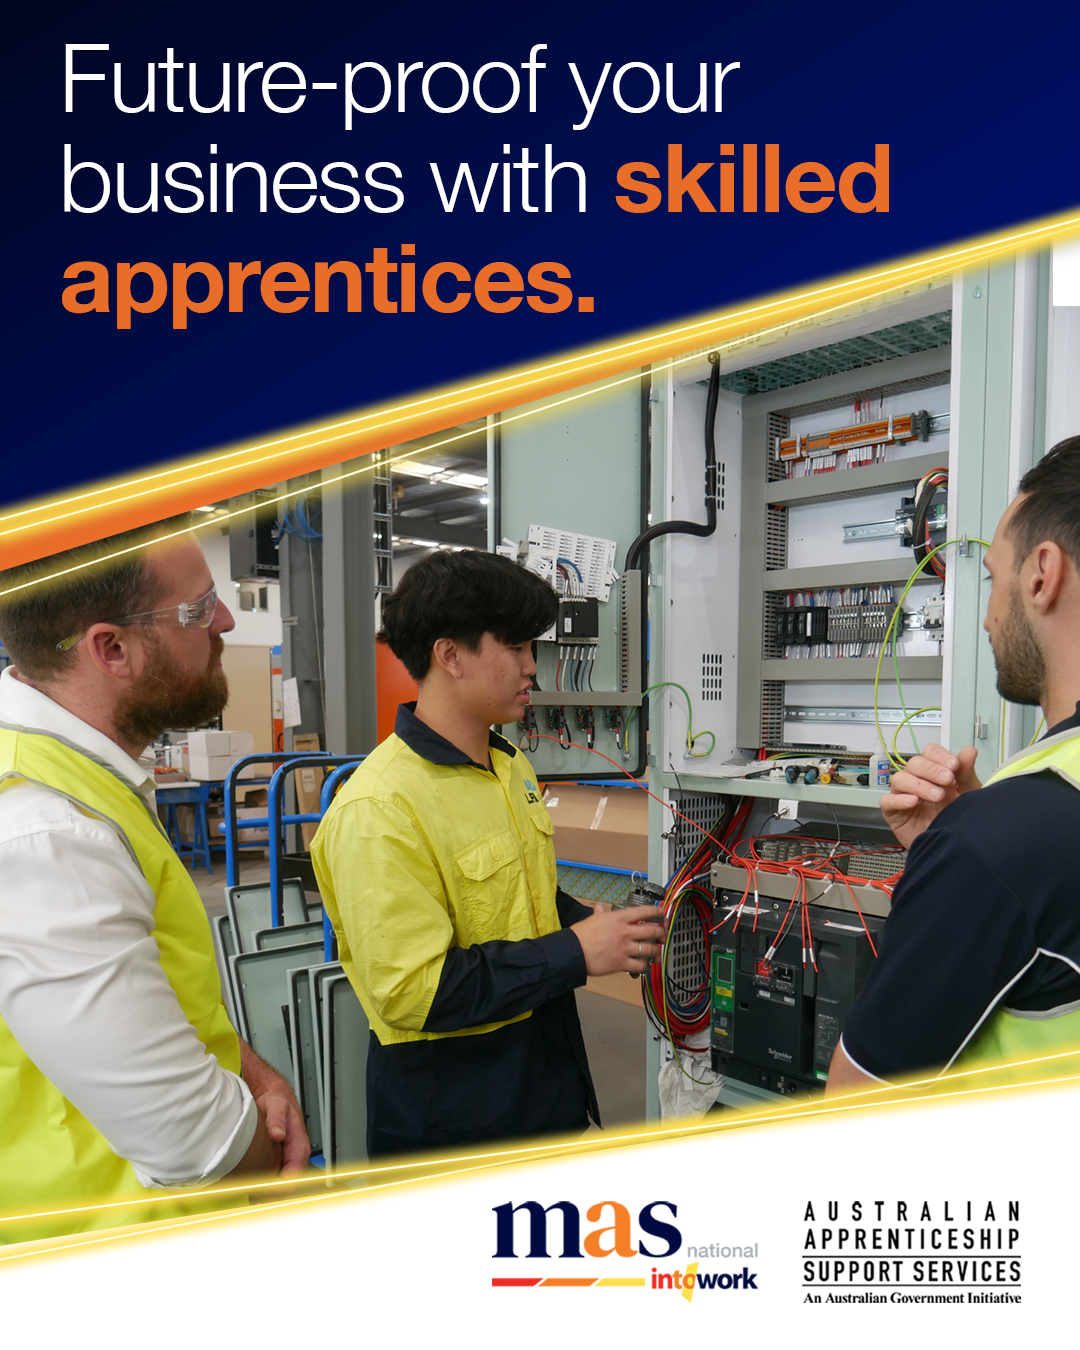
Image ad

- Impressions
- 404,940
- Link clicks
- 5,478
- Landing page views
- 5,080

Mas National
Digital Campaign Performance Report
ACAP and Mas Allied Health
September established the new campaign structure, with each platform making a distinct contribution. Meta generated broad exposure and website visits for ACAP, Google Search recorded form and call response, and LinkedIn attracted traffic around the employer and Allied Health messages. The contact mix, regional response and creative results explain how the different parts of the structure are working.
This is the first month of a completely new set of campaigns. Direct comparison with August would combine different audiences, objectives and campaign structures, so September establishes a fresh baseline. Apprentice Connect Australia Provider activity, referred to here as ACAP, runs across Meta, Google Search and LinkedIn. Mas Allied Health runs across Google Search and LinkedIn, with the shared LinkedIn follower campaign supporting Mas National across both services.
Delivery began on 4 September for ACAP Search and LinkedIn, 6 September for Allied Health Search and 8 September for Meta. ACAP and general Allied Health LinkedIn videos delivered on 17 and 19 days respectively. These results describe the launch period rather than a full month of delivery.
Metrics report pages 1 and 2
The main campaign combines broad visibility with a substantial flow of website visits. Its 138,193 reach and average frequency of 2.98 show both audience breadth and repeat exposure. Landing page activity provides a separate measure of the website response.
Reduced Audience Network delivery gives a clearer read on engagement. Earlier reports identified Audience Network bursts that inflated impressions with little matching engagement. This reliance has been substantially reduced in the new Meta structure: Audience Network contributed just 6.7% of the main campaign’s September impressions. The campaign’s 5,196 landing page views were equivalent to 92.6% of 5,611 link clicks. The placement mix and website activity are consistent with stronger website engagement, with less of the impression distortion identified previously.
Queensland and South Australia produced the strongest regional traffic response. They recorded the most landing page views despite Tasmania carrying the largest impression volume. Queensland also generated the most views relative to impressions. This distinction shows why exposure volume alone does not describe the regional contribution to website activity.
| Region | Impressions | Landing page views | Views per 1,000 impressions |
|---|---|---|---|
| QLD | 79,689 | 1,143 | 14.3 |
| SA | 84,110 | 1,139 | 13.5 |
| NSW | 80,082 | 1,080 | 13.5 |
| ACT | 78,619 | 900 | 11.4 |
| TAS | 89,368 | 934 | 10.5 |
ACAP-03 was the principal contributor to website traffic. It supplied 97.6% of link clicks. September’s traffic result is therefore concentrated in this creative. That contribution reflects the combination of its delivery and response, rather than proving that it would outperform every alternative under equal exposure.
The message is attracting substantial interest from younger audiences. Ages 18-24 supplied 49.9% of link clicks. The main traffic campaign is connecting strongly with this age group, while the other Meta campaign purposes have older leading click profiles. Age describes audience response, not a person’s role or hiring intentions.
Website traffic is established across all five regional ad sets, with Queensland and South Australia contributing particularly strongly relative to exposure. ACAP-03 accounts for most of that activity. The result combines broad geographic visibility with clear concentrations by region, creative and age.
Metrics report pages 3 to 6
The conversion campaign recorded initial attributed actions, while remarketing generated further website visits among its retargeting audience. These results show distinct functions within the Meta structure beyond broad traffic acquisition.
The conversion campaign recorded an initial response across two regions. It generated 575 landing page views and 4 attributed website conversion events, with three events in NSW and one in Tasmania. The event count is small, but it establishes recorded conversion activity alongside the campaign’s website traffic.
Two creatives contributed both website activity and conversion credit. ACAP-06 supplied 310 landing page views and ACAP-05 supplied 264. Both received recorded conversion credit. The response therefore extends across two messages rather than depending on one creative alone.
The leading age groups differ by campaign purpose. Ages 35-44 led the conversion campaign’s link clicks, while ages 45-54 led remarketing. The main traffic campaign had a younger click profile. This shows that the broader structure is attracting activity across different age groups; it does not establish a verified journey by the same people.
Remarketing recorded the strongest all-ad click rate of the three Meta website campaigns. Its 2.23% rate, alongside 305 landing page views, is consistent with an audience already selected for re-engagement. RMK-15 and RMK-17 both contributed visits. The result supports the campaign’s role in maintaining website activity beyond the initial traffic campaigns.
Meta is generating broad traffic, re-engagement and an initial attributed conversion response through separate campaign purposes. The age and creative patterns differ across those purposes. Meta’s recorded conversion events remain attributed platform actions; successful submissions and enquiry quality require separate confirmation.
Meta metrics report pages 7 and 8 and LinkedIn page 15
The audience campaigns brought people to the social profiles and recorded new attributed follows. Their contribution is social visibility and audience response, which is distinct from the website activity measured in the traffic campaigns.
Instagram recorded profile interest as well as new attributed follows. There were 448 profile visits and 12 attributed Instagram follows. The larger profile-visit count shows activity beyond the immediate follow response. These are separate counts and do not establish a visit-to-follow conversion rate.
Facebook also recorded audience activity. The campaign attributed 32 Facebook Page likes. Page likes and Instagram follows are separate measures and describe different forms of response within the Meta audience campaign.
LinkedIn delivered repeated professional visibility. The shared campaign reached approximately 100,985 members at average frequency of 4.05, with 42 attributed follows. The exposure and follow activity show both visibility and an active audience response. This campaign supports both service streams and is reported once.
Audience activity is visible across Facebook, Instagram and LinkedIn, with different measures describing each platform’s contribution. The September figures are attributed campaign actions and do not represent the net change in either platform’s total follower base.
Metrics report page 9 and pages 11 and 12
Search is capturing active interest in Mas National and apprenticeship support, with recorded response through online forms and phone calls. This gives it a contact function alongside the other platforms’ exposure and traffic roles. Individual journeys across platforms are not verified.
Both contact routes are contributing substantially. Approximately 100 primary form conversion actions and 67 calls from ads make up the 167 rounded primary conversion total. Forms account for roughly three fifths of the recorded response and calls for two fifths. Neither route alone describes the campaign’s full contact response.
Branded search shows a particularly strong recorded action rate. The term “mas national” recorded approximately 24 conversion actions from 103 clicks. Its attributed action rate was 23.3%, against 16.01% for the campaign’s primary conversion rate. The stronger response among people searching for the Mas name is consistent with familiarity and more specific interest, although the figures do not identify what created that familiarity.
Queensland and NSW form the main regional Search traffic base. Together they accounted for 73.7% of clicks. Both also contributed strongly to Meta website activity, giving the regional pattern support across two platforms. This is geographic alignment, not proof that the same people used both channels.
LinkedIn is attracting traffic across a professional audience, with Business Development, Operations and Human Resources among the leading recorded job functions. These categories give the response relevant employer context, with demographic counts treated as approximate and overlapping.
| Creative | Landing page clicks | Ad click rate |
|---|---|---|
| ACAP-11 | 2,516 | 3.44% |
| ACAP-09 | 2,200 | 3.26% |
Both image ads are contributing at similar response rates. Their close click rates show that the response is distributed across both messages. Average image-campaign frequency was 7.36, so those responses occurred in a setting with repeated exposure rather than a single contact with each member.
Video recorded a positive initial click response. Its 8.30% ad click rate was higher than the image campaign’s 3.35%, alongside 251 landing page clicks. The video’s smaller delivery base and shorter active period mean the difference describes September’s campaign results rather than establishing a general advantage for video.
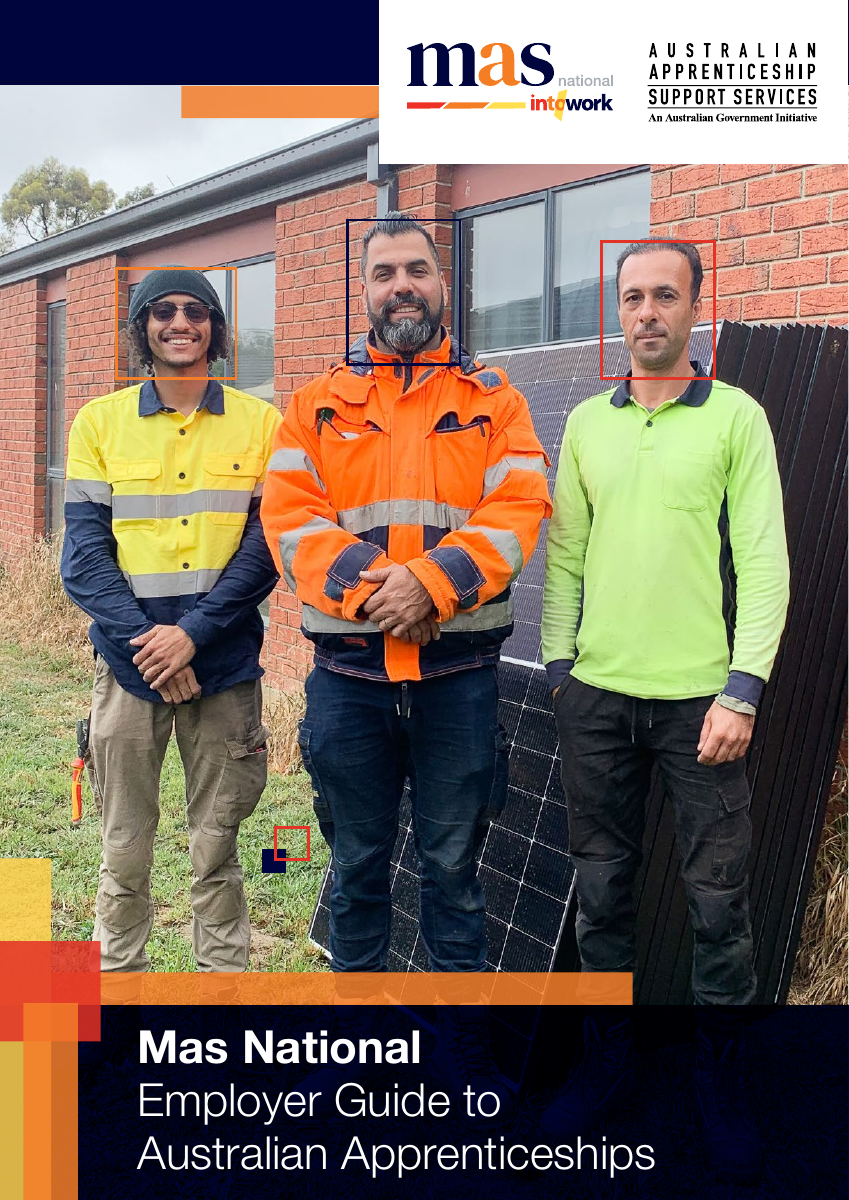
The employer guide recorded its first document uptake. Its 2 downloads show an initial response to the specific information offer. Downloads describe document access and remain separate from the website traffic measured in the other LinkedIn campaigns.
ACAP combines recorded Search contact actions with LinkedIn traffic across a relevant professional audience. Forms and calls both contribute to Search, while LinkedIn’s response extends across two image creatives and video. These measures describe different campaign purposes rather than a single combined conversion result.
Metrics report page 10 and pages 13 and 14
The clearest first-month Search insight is the importance of the telephone response. Calls from ads contributed 89.5% of the 38 primary conversion actions. The recorded response is therefore predominantly phone driven, unlike ACAP’s more balanced form-and-call mix.
The phone route accounts for most primary contact activity. Search recorded 34 calls from ads and 4 primary form actions. Google also recorded 2 MAH-specific form actions outside the primary total. Those additional events are separate from the primary conversion measure.
Queensland generated a stronger share of clicks than exposure. It recorded 53.9% of Search clicks from 39.4% of impressions. Its contribution is therefore particularly strong at the click stage, giving it more weight in the response than impression volume alone would suggest.
The search mix spans provider and broader support interests. Workforce Australia and employment service provider names appear alongside broader consumer support terms. This gives the campaign a range of search contexts around Allied Health, while the recorded actions do not by themselves confirm provider referrals or enquiry suitability.
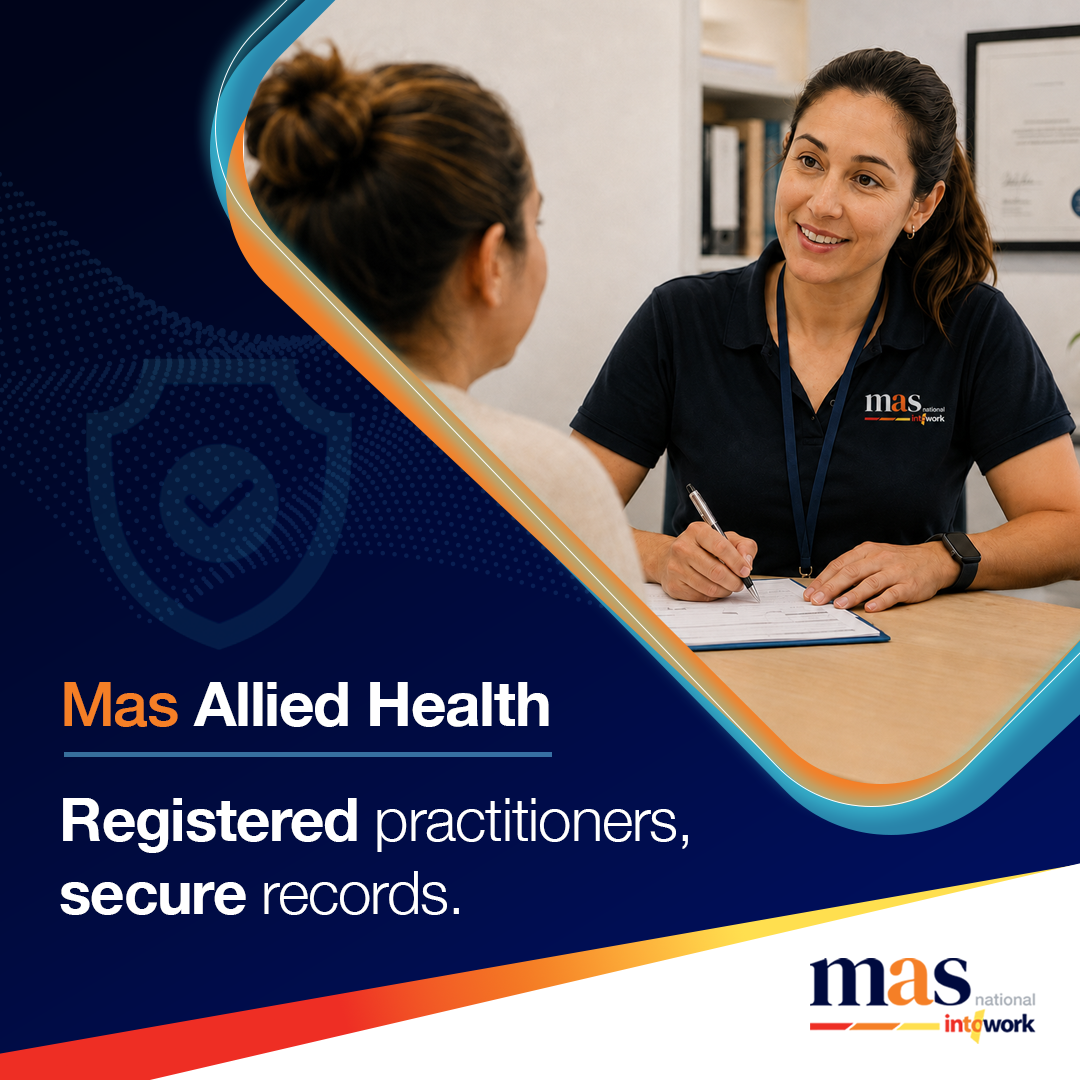
The image campaign’s four messages all generated website clicks at closely grouped rates. Participant support, consultant support, practitioner credentials and satisfaction evidence each contributed. The response therefore extends across several aspects of the Allied Health proposition.
| Creative | Message | Landing page clicks | Ad click rate |
|---|---|---|---|
| MAH-04 | Participant support | 552 | 3.13% |
| MAH-05 | Consultant support | 482 | 2.91% |
| MAH-07 | Practitioner credentials | 537 | 2.93% |
| MAH-06 | Participant satisfaction | 427 | 2.92% |
Creative response is distributed across the image rotation. With average frequency of 11.51, the audience experienced repeated campaign exposure. The similar creative click rates show that activity continued across several messages rather than concentrating in one execution.
Lead the Way contributed strongly within the QLD video campaign. MAH-14 recorded a 9.12% click rate and 929 landing page clicks. BuildHer Up also attracted 211 clicks. Both belong to the QLD campaign, but represent distinct programme messages; their contribution is assessed within that shared geographic scope.
The general Allied Health video also attracted an initial response. MAH-03 recorded 416 landing page clicks and a 13.02% click rate. This provides a positive initial result for the general service message, assessed separately from the QLD programme videos and their different purposes.
The professional audience provides relevant referral context. Individual and Family Services, Civic and Social Organisation, and Staffing and Recruitment are among the prominent named industries in the breakdown. These sectors align with the service’s provider-facing messages. The categories are approximate and overlapping, so they describe audience context rather than confirmed provider referrals.
Allied Health has established a recorded phone response, a strong Queensland traffic contribution and website activity across several LinkedIn messages. The results show distinct responses to general service and programme-specific advertising, with several creative themes contributing within the image campaign.
| Advertiser | Impression share | Top of page rate |
|---|---|---|
| Mas National | <10% | 75.95% |
| megt.com.au | 19.15% | 77.88% |
| seek.com | 17.63% | 87.56% |
| jora.com | 12.67% | 85.87% |
| apprenticeshipsupport.com.au | <10% | 80.37% |
| adfcareers.gov.au | <10% | 77.57% |
| indeed.com | <10% | 78.50% |
Mas National’s strongest competitive result was its placement when ads appeared. Its 37.44% rate of appearing in the first ad position was ahead of MEGT (25.16%), Apprenticeship Support Australia (25.20%) and SEEK (36.59%). The larger advertisers held broader auction coverage, while Mas secured prominent positions within its search presence. This shows Mas competing effectively for prominent ad placement in September.
Metrics report pages 16 to 22
The website recorded 40,256 page views and 13,070 user engagement events from all traffic sources. This provides context for the wider information journey around Mas National and its Allied Health page, while campaign results remain the primary evidence of advertising performance.
The general contact form accounted for 361 of 386 recorded form submission events. Website form activity is therefore concentrated in the general contact route. These are all-source website events, so that concentration does not establish which service was requested or how many submissions came from the advertising campaigns.
Mas National staff maintain GA4 and Google Tag Manager. Tracking changes made without notification have affected reporting consistency in the past, so these website figures remain indicative. Event definitions, duplicate controls and campaign attribution have not been independently confirmed. The campaign data provides the firmer basis for assessing the advertising activity.
Figures describe platform-recorded activity. Google conversion credit may be fractional; its campaign conversion rate uses primary conversions divided by interactions. Meta landing page views and link clicks are separate counts, and LinkedIn landing page clicks are click-throughs. Counts and reach are not combined across platforms into unique enquiry or audience totals.
Platform-recorded campaign activity. Website events are indicative context from all traffic sources. Reach, clicks and conversion measures are distinct and should be read within each campaign.
Campaign: Mas - BA - V2
| Region | Impressions | Reach | All-ad CTR | Link clicks | Landing page views |
|---|---|---|---|---|---|
| TAS | 89,368 | 22,374 | 1.23% | 1,002 | 934 |
| SA | 84,110 | 29,306 | 1.53% | 1,208 | 1,139 |
| NSW | 80,082 | 34,887 | 1.64% | 1,236 | 1,080 |
| QLD | 79,689 | 36,217 | 1.66% | 1,212 | 1,143 |
| ACT | 78,619 | 20,488 | 1.26% | 953 | 900 |
| Total | 411,868 | 138,193 | 1.46% | 5,611 | 5,196 |
Reach is not added across regional rows.
Image ad
Video ad
Image ad
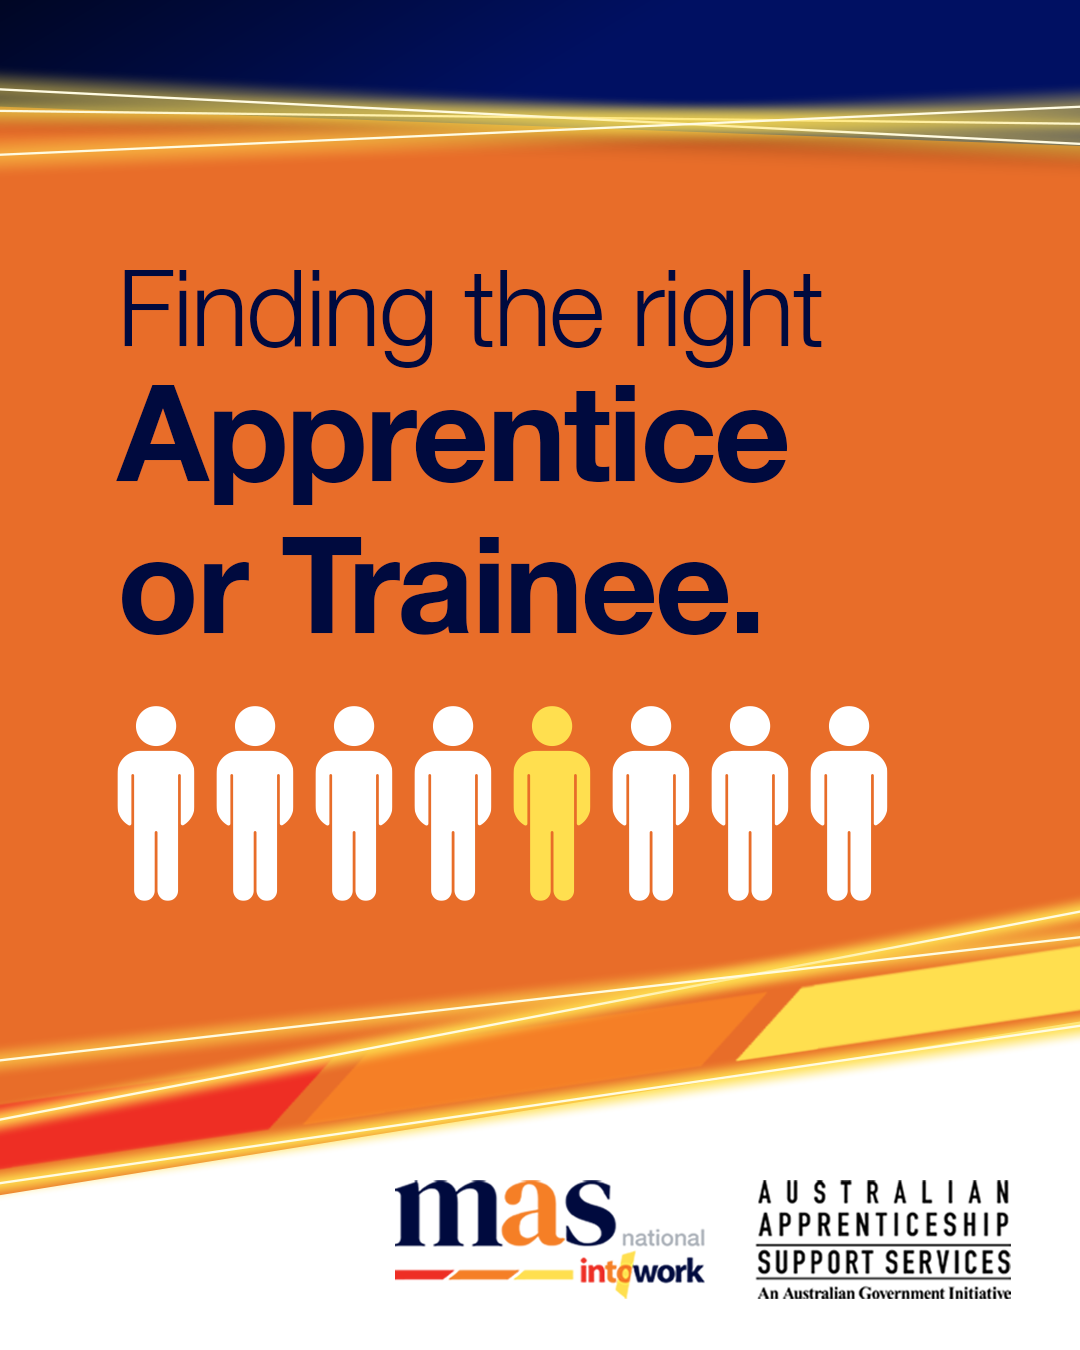
Image ad
| Creative | Impressions | Reach | Link clicks |
|---|---|---|---|
| ACAP-03 | 79,324 | 34,480 | 1,214 |
| ACAP-04 | 416 | 326 | 16 |
| ACAP-01 | 193 | 152 | 4 |
| ACAP-02 | 149 | 126 | 2 |
| Creative | Impressions | Reach | Link clicks |
|---|---|---|---|
| ACAP-03 | 78,638 | 35,846 | 1,173 |
| ACAP-04 | 677 | 517 | 28 |
| ACAP-01 | 271 | 224 | 7 |
| ACAP-02 | 103 | 80 | 4 |
| Creative | Impressions | Reach | Link clicks |
|---|---|---|---|
| ACAP-03 | 83,683 | 29,135 | 1,200 |
| ACAP-01 | 321 | 241 | 5 |
| ACAP-04 | 72 | 65 | 1 |
| ACAP-02 | 34 | 32 | 2 |
| Creative | Impressions | Reach | Link clicks |
|---|---|---|---|
| ACAP-03 | 76,443 | 19,450 | 928 |
| ACAP-01 | 2,113 | 1,543 | 25 |
| ACAP-04 | 33 | 26 | 0 |
| ACAP-02 | 30 | 27 | 0 |
| Creative | Impressions | Reach | Link clicks |
|---|---|---|---|
| ACAP-03 | 86,852 | 21,516 | 963 |
| ACAP-01 | 2,335 | 1,648 | 36 |
| ACAP-04 | 154 | 114 | 1 |
| ACAP-02 | 27 | 26 | 2 |
Campaign: MAS - C - V2
| Region | Impressions | Reach | Link clicks | Landing page views | Conversion events |
|---|---|---|---|---|---|
| TAS | 43,609 | 11,240 | 168 | 136 | 1 |
| SA | 32,438 | 8,822 | 145 | 107 | 0 |
| ACT | 29,363 | 6,768 | 153 | 118 | 0 |
| QLD | 26,070 | 9,719 | 114 | 88 | 0 |
| NSW | 23,302 | 9,019 | 150 | 126 | 3 |
| Total | 154,782 | 44,385 | 730 | 575 | 4 |
Meta conversion events are attributed platform actions. Successful submissions and enquiry quality require separate confirmation.
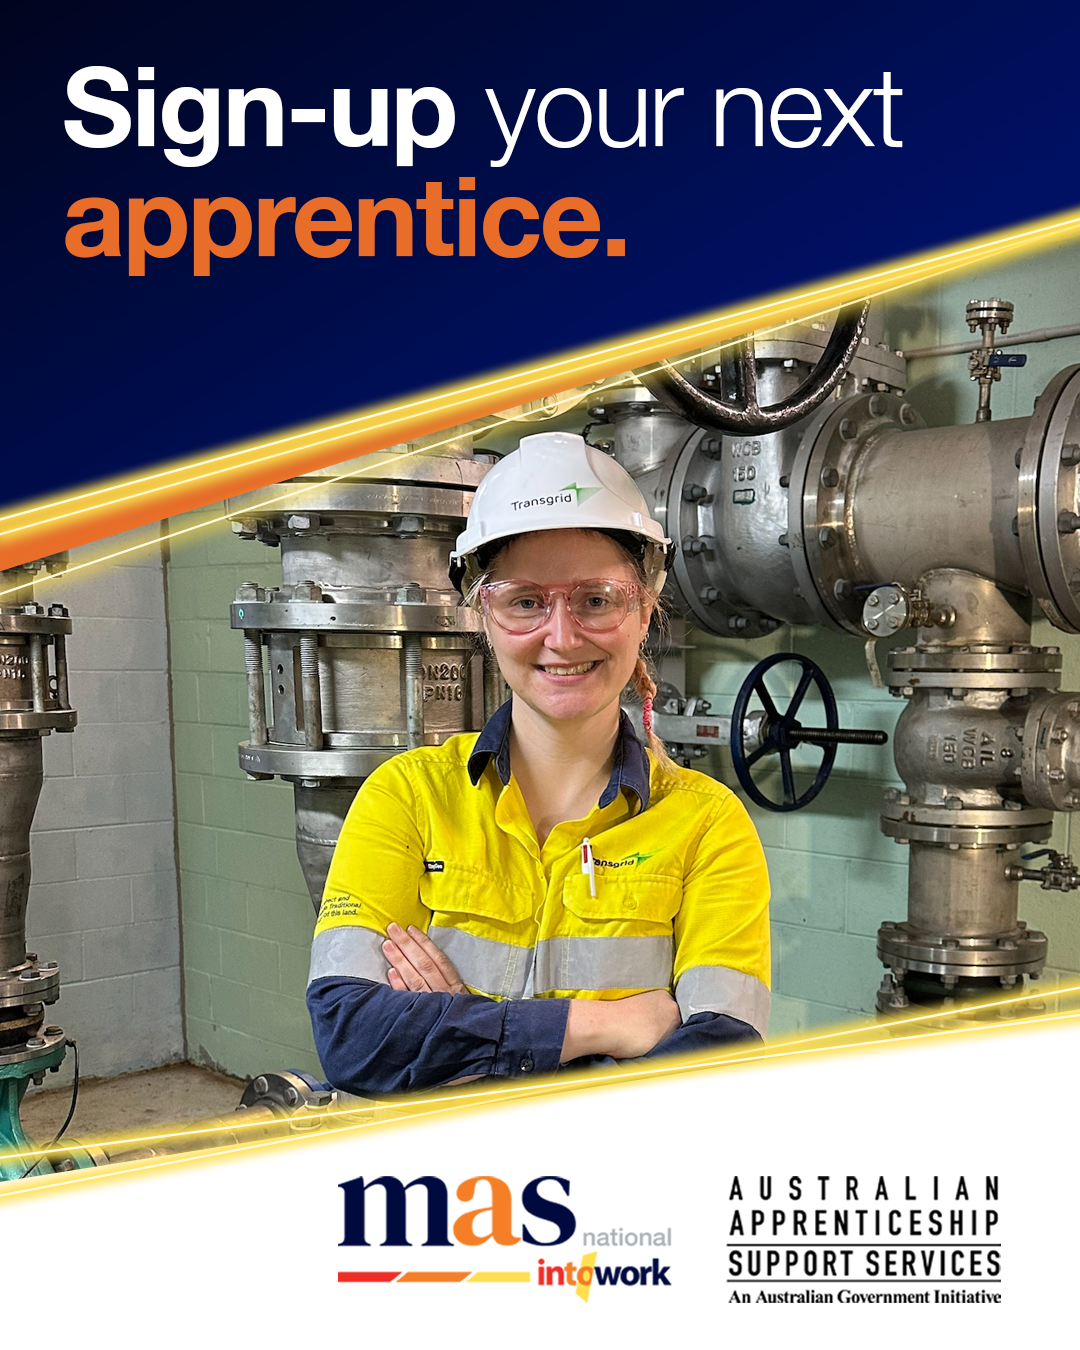
Image ad
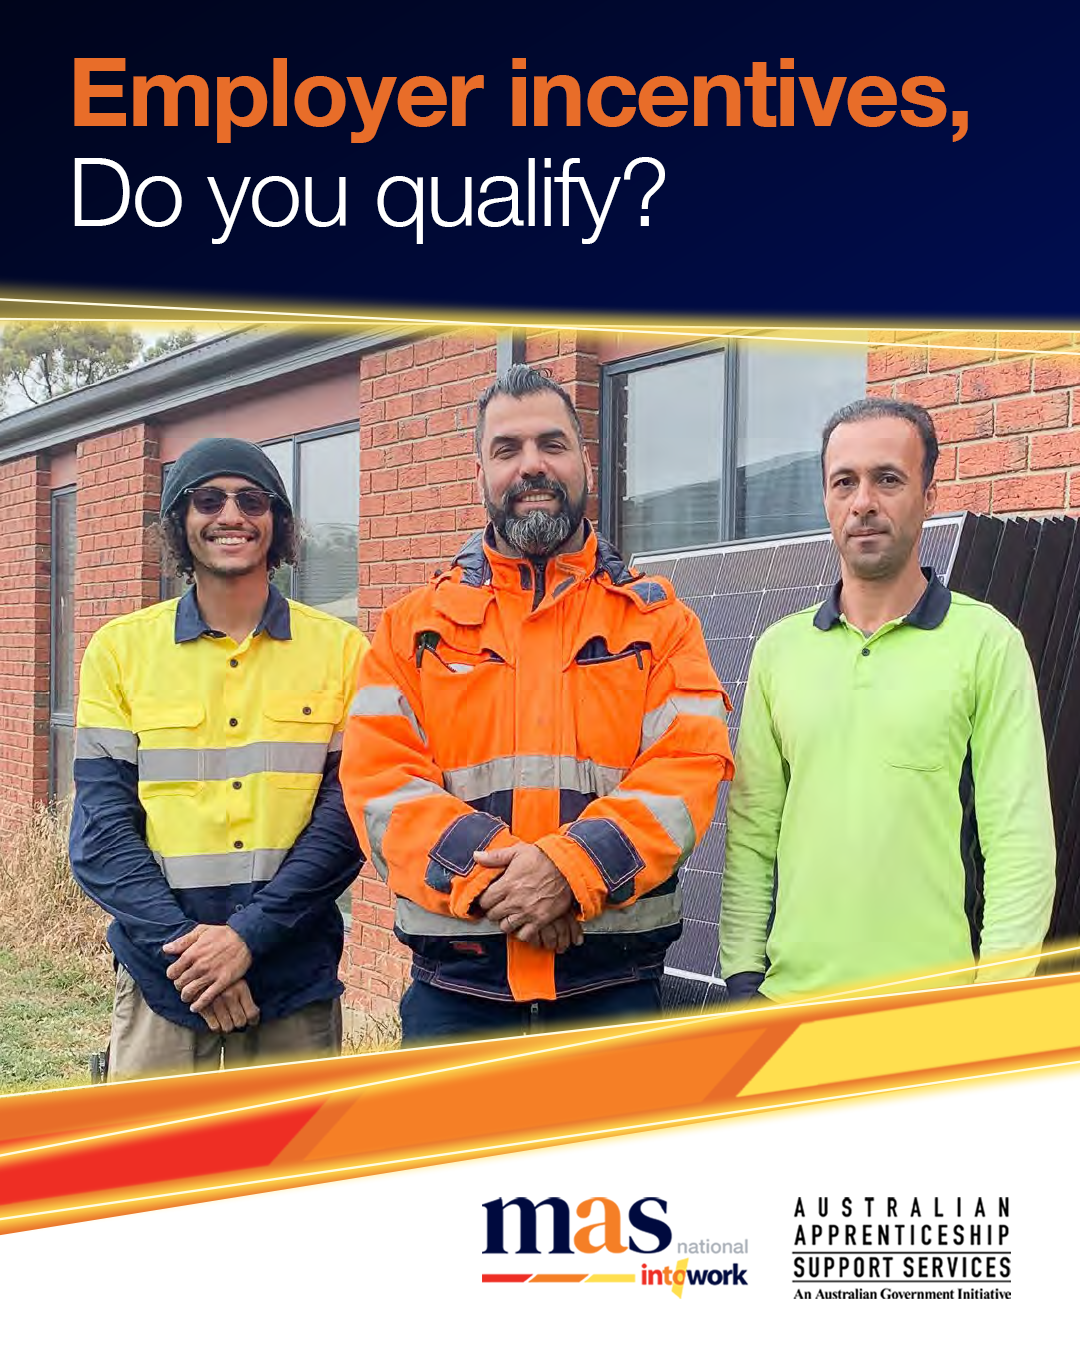
Image ad
Carousel
| Creative | Impressions | Link clicks | Conversion events |
|---|---|---|---|
| ACAP-06 | 16,397 | 94 | 3 |
| ACAP-05a | 6,899 | 56 | 0 |
| ACAP-08 | 6 | 0 | 0 |
| Creative | Impressions | Link clicks | Conversion events |
|---|---|---|---|
| ACAP-06 | 17,367 | 67 | 0 |
| ACAP-05a | 8,690 | 47 | 0 |
| ACAP-08 | 13 | 0 | 0 |
| Creative | Impressions | Link clicks | Conversion events |
|---|---|---|---|
| ACAP-06 | 25,374 | 105 | 0 |
| ACAP-05a | 7,042 | 38 | 0 |
| ACAP-08 | 22 | 2 | 0 |
| Creative | Impressions | Link clicks | Conversion events |
|---|---|---|---|
| ACAP-06 | 15,244 | 84 | 0 |
| ACAP-05a | 13,976 | 69 | 0 |
| ACAP-08 | 143 | 0 | 0 |
| Creative | Impressions | Link clicks | Conversion events |
|---|---|---|---|
| ACAP-05a | 32,689 | 127 | 1 |
| ACAP-06 | 10,869 | 40 | 0 |
| ACAP-08 | 51 | 1 | 0 |
Campaign: Mas - RMK - V2
| Region | Impressions | Reach | All-ad CTR | Link clicks |
|---|---|---|---|---|
| NSW | 8,986 | 2,462 | 2.36% | 172 |
| QLD | 7,587 | 2,147 | 2.69% | 117 |
| SA | 7,583 | 1,737 | 1.74% | 91 |
| TAS | 3,564 | 826 | 2.02% | 25 |
| ACT | 2,597 | 564 | 2.19% | 36 |
| Total | 30,317 | 7,640 | 2.23% | 441 |
Reach is not added across regional rows.
Video ad
Video ad
Image ad
| Measure | Facebook and Instagram | LinkedIn shared campaign |
|---|---|---|
| Impressions | 32,275 | 408,853 |
| Reach | 16,053 | 100,985 (approx.) |
| Clicks | 786 link clicks | 96 ad clicks |
| All-ad CTR | 3.47% | 0.02% |
| Average frequency | 2.01 | 4.05 |
Facebook Page likes, Instagram follows and LinkedIn follows are distinct attributed actions. They do not represent the net change in each platform’s follower base. The shared LinkedIn campaign supports both services and is reported once.
Reach is not added across regional rows.
| Region | Impressions | Reach | Link clicks |
|---|---|---|---|
| NSW | 14,888 | 7,677 | 383 |
| QLD | 9,733 | 5,045 | 231 |
| SA | 5,252 | 2,543 | 123 |
| TAS | 1,853 | 909 | 39 |
| ACT | 549 | 340 | 10 |
Image ad

Video ad
| Measure | ACAP employers | Allied Health providers |
|---|---|---|
| Impressions | 9,049 | 2,502 |
| Clicks | 1,043 | 154 |
| Click-through rate | 11.53% | 6.16% |
| Primary form actions | 100 (rounded) | 4 |
| Calls from ads | 67 | 34 |
| Primary conversion actions | 167 (rounded) | 38 |
| Primary conversion rate | 16.01% | 24.68% |
Primary Google conversion credit can be fractional. The campaign conversion rate uses primary conversions divided by interactions. Allied Health also recorded 2 MAH-specific form actions outside the primary total.
| Search term | Impressions | Clicks | Conversion actions |
|---|---|---|---|
| mas national | 196 | 103 | 24.00 |
| apprentice connect australia provider | 52 | 20 | 4 |
| masnational com au | 8 | 5 | 4 |
| mas national phone number | 5 | 3 | 4.00 |
| megt apprenticeship | 83 | 13 | 3 |
| mas apprenticeships | 26 | 10 | 3 |
| megt brisbane | 41 | 6 | 3 |
| mas national adelaide | 24 | 7 | 2 |
| electrical apprenticeship brisbane | 28 | 4 | 2 |
| 1300 apprentice | 25 | 3 | 2 |
| apprentice connect provider | 5 | 3 | 2 |
| civil construction apprenticeship | 8 | 2 | 2 |
| mature age apprenticeship electrician | 3 | 1 | 2 |
| Search term | Impressions | Clicks | Conversion actions |
|---|---|---|---|
| busy ability north lakes | 10 | 4 | 4 |
| mas apprenticeship | 13 | 6 | 3 |
| workforce australia contact | 21 | 6 | 2 |
| psychosis hotline | 1 | 1 | 1.50 |
| workforce australia | 439 | 20 | 1 |
| beyond blue | 10 | 3 | 1 |
| mas national apprenticeship | 5 | 3 | 1 |
| apm earlville | 8 | 2 | 1 |
| max employment rockhampton | 2 | 2 | 1 |
| apg workforce brisbane | 1 | 2 | 1 |
| etc strathpine | 10 | 1 | 1 |
| tursa lismore | 5 | 1 | 1 |
| apm inala | 3 | 1 | 1 |
| Campaign | Impressions | Approx. reach | Ad clicks | CTR | Campaign result |
|---|---|---|---|---|---|
| Website traffic, images | 140,577 | 19,102 | 4,716 | 3.35% | 4,716 landing page clicks |
| Website traffic, video | 3,025 | 1,223 | 251 | 8.30% | 251 landing page clicks |
| Employer guide | 22,231 | 10,802 | 60 | 0.27% | 2 document downloads |
LinkedIn landing page clicks are click-throughs. Reach and demographic counts are approximate and may overlap across campaigns and categories.
Reported landing page clicks. Top five named categories. Approximate counts; categories may overlap.
Reported landing page clicks. Top five named categories. Approximate counts; categories may overlap.
Image ad
Image ad

Video ad
Employer guide
| Campaign | Impressions | Approx. reach | Ad clicks | CTR | Campaign result |
|---|---|---|---|---|---|
| Allied Health images | 67,156 | 5,835 | 1,998 | 2.98% | 1,998 landing page clicks |
| Lead the Way / BuildHer Up, QLD | 16,068 | 3,749 | 1,140 | 7.09% | 1,140 landing page clicks |
| Allied Health video | 3,194 | 806 | 416 | 13.02% | 416 landing page clicks |
Professional audience categories provide context for the traffic. They do not confirm provider referrals.
Reported landing page clicks. Top five named categories. Approximate counts; categories may overlap.
Reported landing page clicks. Top five named categories. Approximate counts; categories may overlap.
Image ad
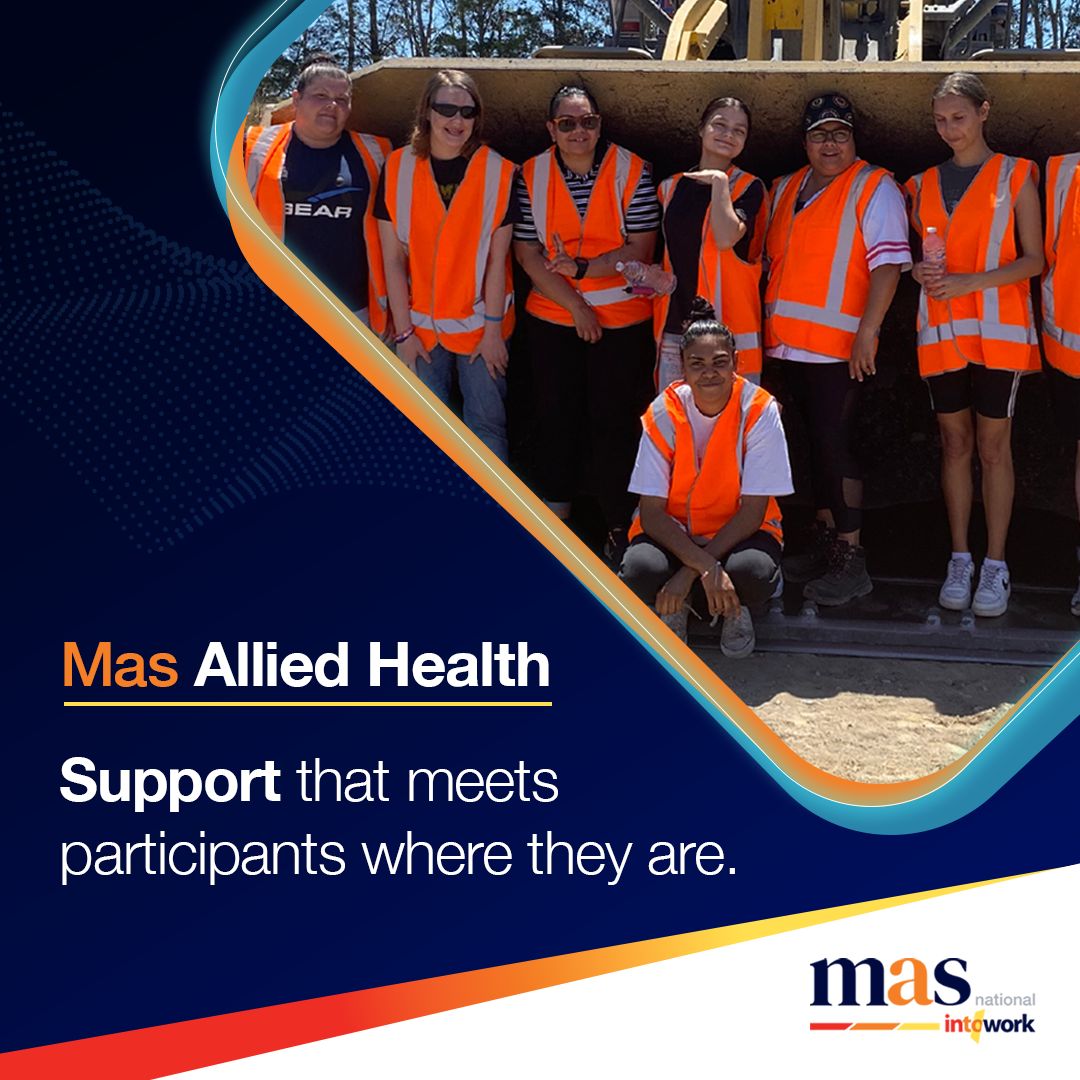
Image ad
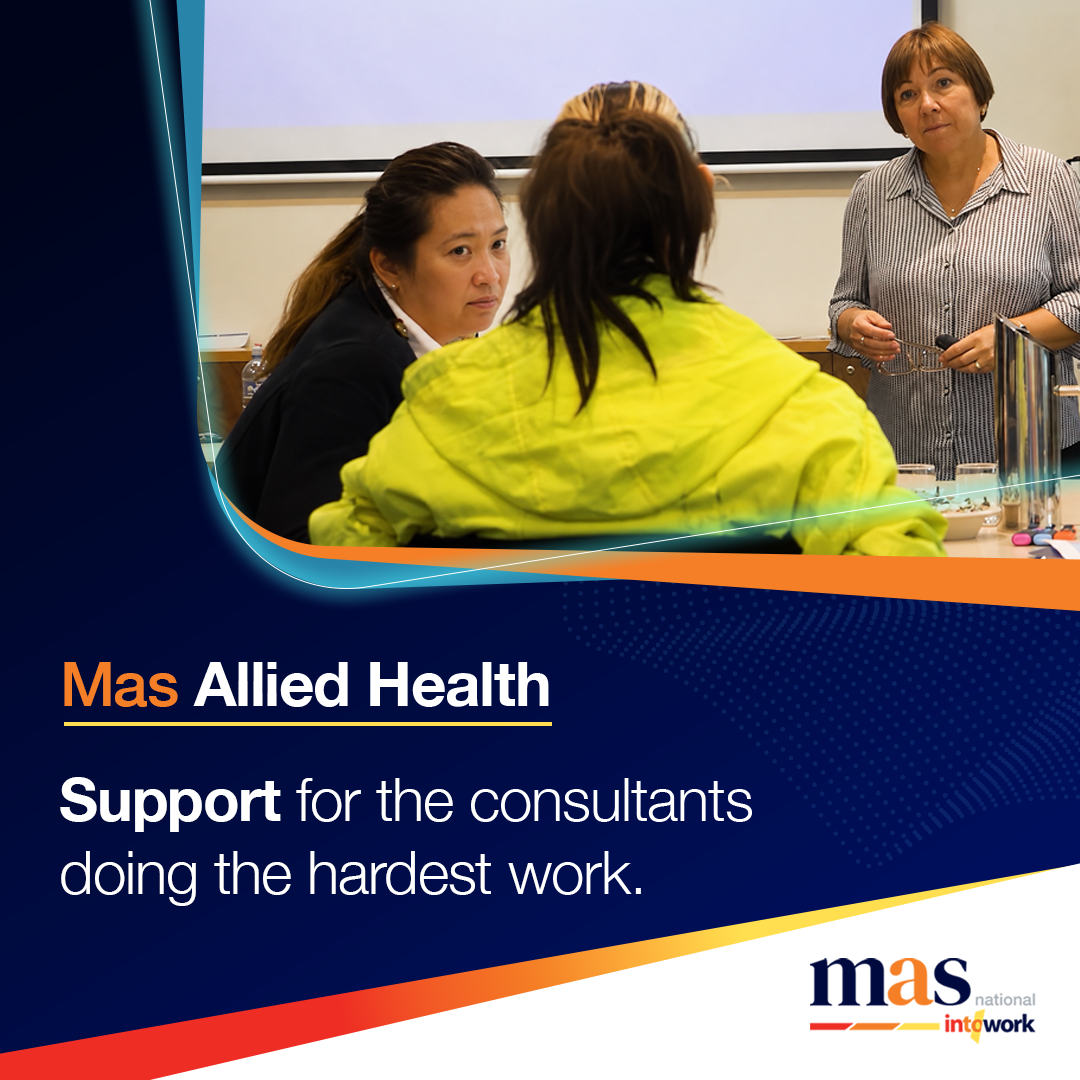
Image ad
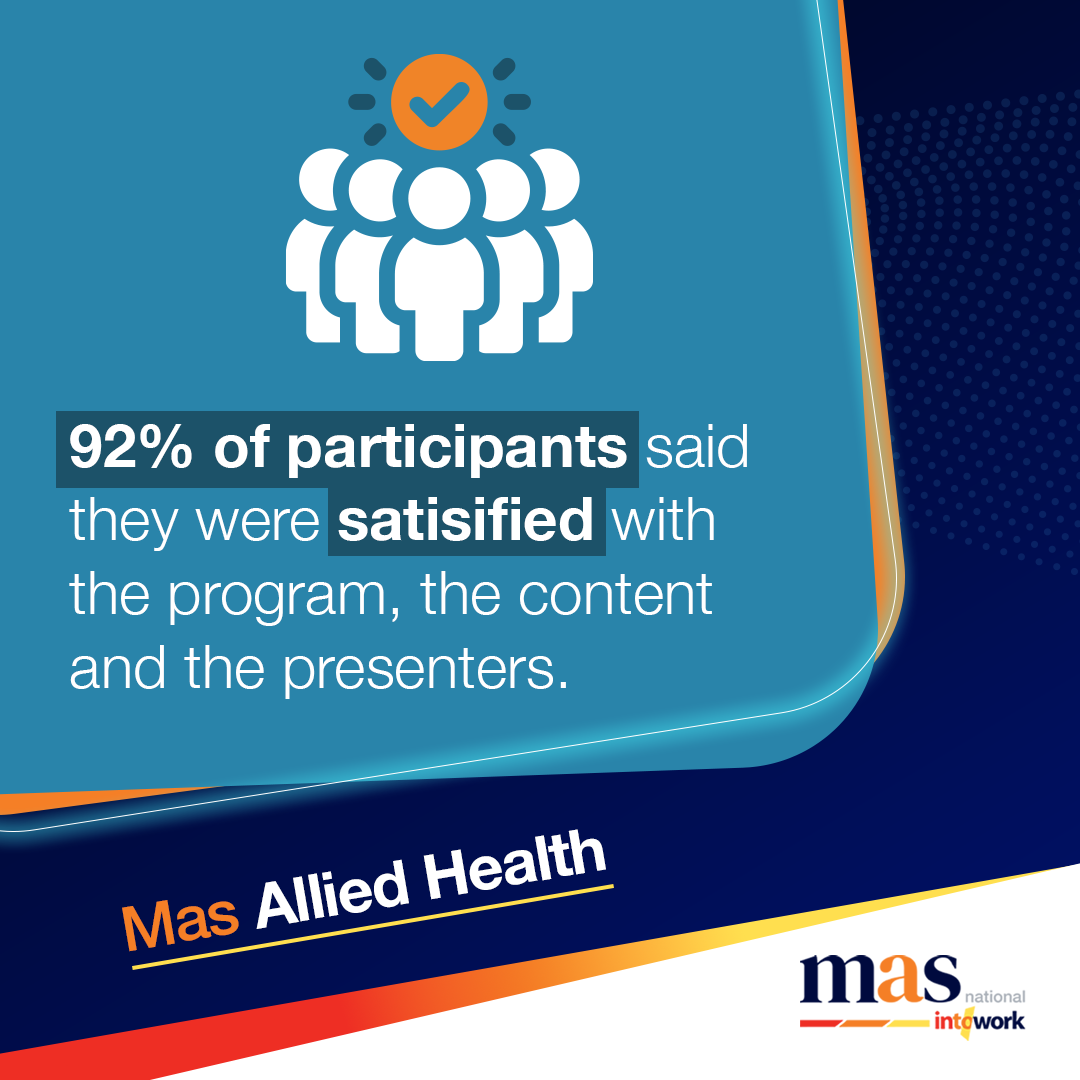
Image ad
Video ad
Lead the Way, QLD video
BuildHer Up, QLD video
| Region | Page views | Engagement events | All clicks | Phone clicks | Form submissions | Contact Us |
|---|---|---|---|---|---|---|
| TAS | 1,607 | 666 | 115 | 9 | 19 | 19 |
| QLD | 8,878 | 2,899 | 480 | 49 | 79 | 77 |
| NSW | 10,158 | 3,253 | 488 | 59 | 90 | 81 |
| SA | 5,267 | 2,028 | 452 | 49 | 76 | 70 |
| ACT | 1,571 | 685 | 35 | 2 | 5 | 5 |
| Region | Sign Up Apprentice | Sign Up Apprentice Now |
|---|---|---|
| TAS | 0 | 0 |
| QLD | 0 | 1 |
| NSW | 6 | 5 |
| SA | 2 | 4 |
| ACT | 0 | 0 |
These are all-source website events. GA4 tracking consistency, event definitions, duplicate controls and campaign attribution are unverified. The five regional rows do not represent every region included in the all-region totals. Other submission event names can overlap and are not added.
361 recorded events
12 recorded events
10 recorded events