ACAP-01
Video ad
- Impressions
- 16,018
- Link clicks
- 1,748
- Landing page views
- 1,470
- Attributed conversion events
- 0

Mas National
Digital Campaign Performance Report
ACAP and Mas Allied Health
October extended the new campaign structure through a full calendar month. The main Meta campaign and LinkedIn image activity attracted more website traffic overall, while the response from remarketing and ACAP Search weakened. Allied Health Search retained its predominantly phone-based contact pattern. The combined result is broader traffic alongside uneven progress towards contact actions.
September was a launch period: Meta began on 8 September, ACAP Search and LinkedIn on 4 September, and Allied Health Search on 6 September. October totals therefore cover longer delivery periods. Daily activity and response rates are considered alongside monthly totals to distinguish additional delivery time from a stronger response.
Apprentice Connect Australia Provider activity, referred to here as ACAP, runs across Meta, Google Search and LinkedIn. Mas Allied Health runs across Google Search and LinkedIn. The shared LinkedIn follower campaign supports Mas National across both services and is reported once.
The main Meta campaign recorded 442,080 impressions and reached 152,502 people. Reach grew 10.4% from September while frequency eased from 2.98 to 2.90. The larger impression total was therefore accompanied by broader audience coverage, rather than more repetition per person.
Landing page views increased 13.7% to 5,908. However, October averaged 191 views per day compared with 226 across September’s 23 active days. The monthly increase reflects a longer delivery period, while daily website response was lower. Landing page views were equivalent to 89.7% of link clicks, compared with 92.6% in September.
Audience Network contributed 20.5% of impressions, compared with 6.7% in September. This placement change matters because impressions, reach and website response are separate measures. Audience Network also recorded 1,630 landing page views in October, so its contribution cannot be described as exposure without website activity. These platform-recorded views do not establish visit quality.
| Region | Impressions | Landing page views | Views per 1,000 impressions |
|---|---|---|---|
| NSW | 99,641 | 1,420 | 14.3 |
| QLD | 97,200 | 1,348 | 13.9 |
| SA | 83,008 | 1,135 | 13.7 |
| ACT | 84,597 | 1,014 | 12.0 |
| TAS | 77,634 | 991 | 12.8 |
New South Wales led both landing page volume and views relative to impressions. Regional contribution shifted from September’s Queensland and South Australia lead. This supports reading website response alongside the distribution of exposure, rather than ranking regions on impressions alone.
The main campaign continues to establish broad visibility and a measurable website response. Its higher monthly visit total should be read with the lower daily response and changed placement mix; it does not demonstrate that traffic quality improved.
The website conversion campaign recorded 663 landing page views and five attributed pixel lead events, compared with 575 views and four events in September. The increase in views was smaller than the increase in delivery days. Daily views declined from 25 to about 21, while the small conversion-event counts provide limited evidence of a sustained change in contact response.
Impressions increased 8.8%, but reach fell 15.3% to 37,608 and frequency rose from 3.49 to 4.48. Delivery became more concentrated within a smaller audience. This pattern is analytically different from the main traffic campaign, where reach expanded and frequency eased. One pixel lead event was attributed in each of the five regional ad sets, but the count does not confirm five distinct enquiries.
The conversion campaign retained an initial contact signal while increasing repeated exposure. The present evidence supports monitoring the relationship between audience concentration and subsequent response; it does not establish stronger enquiry generation.
Remarketing recorded 79 landing page views, down from 305, and 147 link clicks, down from 441. Impressions were only 3.1% lower and reach was on par with September at 7,708. The substantial response decline therefore occurred despite a similar level of audience coverage. A longer reporting period does not explain the lower volume.
All-ad click-through rate fell from 2.23% to 1.22%. Frequency eased from 3.97 to 3.81, so the account data does not support attributing the decline to a higher repetition rate. No pixel lead events were recorded. The change is in response within the remarketing audience, rather than a comparable reduction in exposure.
Remarketing was the weakest part of October’s website traffic response. Its existing audience coverage did not translate into the September level of return visits, and the data does not establish the cause of that change.
The Meta audience campaign recorded 24 attributed Facebook Page likes and 13 Instagram follows, compared with 32 and 12 respectively in September. Its 35,222 impressions reached 14,240 people, with frequency increasing to 2.47. More exposure was concentrated within a smaller audience, while the Facebook Page-like response was lower.
The shared LinkedIn campaign recorded 48 follows, up from 42, across an approximate reach of 99,053. These are attributed platform actions, rather than the net change in account followers. Facebook Page likes, Instagram follows and LinkedIn follows remain separate measures and are not combined into one audience-growth total.
Audience development continued across the platforms, with a stronger LinkedIn follow count and a weaker Facebook Page-like count. These campaigns support the ongoing visibility of Mas National, with their contribution assessed separately from website contact activity.
ACAP Search recorded 1,109 clicks from 8,460 impressions. Click-through rate increased from 11.53% to 13.11%, despite fewer impressions. The ads attracted a higher share of available search attention, but that stronger click response did not carry through to recorded contact actions.
Primary conversion actions fell from about 167 to 131: approximately 83 website form actions and 48 calls from ads. The primary conversion rate declined from 16.01% to 11.81%. Across 31 days, the campaign recorded about 4.2 primary actions per day, compared with 6.2 over September’s 27 active days. Website forms still made up the larger share of the contact mix.
Lead Submit ALL is a broad website form action. These results show conversion events attributed to ACAP Search, rather than a verified count of ACAP-specific enquiries. Search terms retain brand and apprenticeship-provider intent, but the recorded term breakdown does not establish the relevance of every resulting contact.
ACAP LinkedIn recorded 6,051 landing page clicks, up from 4,967. Almost all came from image ads: image-campaign clicks increased to 6,042 while approximate reach grew 19.0%. Frequency rose from 7.36 to 10.34, and the image-campaign click rate declined from 3.35% to 2.57%. Traffic expanded alongside greater repetition and a weaker click response per impression.
| Creative | Impressions | Landing page clicks | Ad click rate |
|---|---|---|---|
| ACAP-09 | 82,905 | 1,300 | 1.57% |
| ACAP-11 | 152,232 | 4,742 | 3.11% |
The two image messages diverged. ACAP-11 generated 78.5% of image clicks and achieved about twice the click rate of ACAP-09. This is a change from September, when their rates were similar. The employer guide recorded six document downloads, compared with two. The video campaign recorded only 266 impressions and nine landing page clicks, so its lower total response reflects very limited delivery and should not be used as a broad judgement about video.
ACAP’s channels produced different outcomes: Search was more likely to attract a click but less likely to record a contact action, while LinkedIn’s larger traffic response was concentrated in one image message. These are distinct signals, and higher combined click volume does not resolve the weaker Search contact response.
Allied Health Search recorded 43 primary conversion actions, compared with 38 in September. Calls from ads increased from 34 to 39, while broad website form actions remained at four. Calls accounted for 90.7% of the total, retaining the phone-led response established in September.
Clicks increased 17.5% to 181 and click-through rate rose from 6.16% to 7.70%. The primary conversion rate was 23.76%, slightly below September’s 24.68%. The campaign recorded more primary actions overall, but about 1.4 per day compared with 1.5 across September’s 25 active days. This is an increase in monthly volume without evidence of an improved daily response.
Allied Health LinkedIn recorded 4,010 landing page clicks, up from 3,554. The general image campaign delivered 2,665 clicks, while the Queensland Lead the Way and BuildHer Up campaign delivered 1,343. The general Allied Health video campaign contributed only two clicks from 33 impressions.
Image-campaign frequency rose from 11.51 to 16.71 as click-through rate declined from 2.98% to 2.55%. The Queensland campaign’s frequency rose from 4.29 to 9.51 and its click rate declined from 7.09% to 3.18%. These changes show rising repetition alongside a lower response per impression; they do not prove creative fatigue.
| Creative | Message | Landing page clicks | Ad click rate |
|---|---|---|---|
| MAH-14 | Lead the Way | 1,234 | 4.39% |
| MAH-13 | BuildHer Up | 109 | 0.77% |
Lead the Way generated 91.9% of the Queensland campaign’s landing page clicks. Image response was also uneven, with MAH-06 recording the highest click rate at 2.93%. Business Development, Operations and Community and Social Services featured in the professional audience response. These categories provide referral and service context, but do not confirm provider referrals.
Allied Health continued to generate recorded phone response through Search and website traffic through LinkedIn. The larger monthly totals should be read alongside broadly held Search response rates and increasing LinkedIn repetition. The strongest LinkedIn click response was concentrated in specific service messages.
The production website recorded 42,668 page views, up 6.0% from September, and 13,242 user engagement events, up 1.3%. Phone clicks increased from 203 to 210, while general click events declined from 1,942 to 1,814. The measures did not move together, so greater page-view volume should not be read as uniformly stronger website interaction.
These website figures include all traffic sources on masnational.com.au and provide context alongside platform-attributed activity. Event names can overlap, and campaign attribution, tracking consistency and duplicate controls have not been independently established. The website event counts are not added to the advertising platforms’ conversion totals.
October’s central distinction is between traffic scale and subsequent response. Broader monthly traffic was supported by a longer delivery period and repeated LinkedIn exposure, while the reduced response from remarketing and ACAP Search limited the evidence of stronger progression towards contact.
The report therefore supports evaluating each channel by its role: audience coverage for visibility, confirmed page loads or click-throughs for traffic, and attributed form or call events for contact response. Read together, these measures show continued campaign influence across the two services, with the greatest uncertainty around the depth and relevance of the additional traffic.
Platform-recorded campaign activity. Website events provide indicative context from all traffic sources. Reach, clicks and conversion measures are distinct and should be read within each campaign.
Campaign: Mas - BA - V2
| Region | Impressions | Reach | All-ad CTR | Link clicks | Landing page views |
|---|---|---|---|---|---|
| SA | 83,008 | 25,182 | 1.51% | 1,281 | 1,135 |
| QLD | 97,200 | 44,974 | 1.61% | 1,471 | 1,348 |
| NSW | 99,641 | 48,502 | 1.65% | 1,552 | 1,420 |
| TAS | 77,634 | 17,956 | 1.50% | 1,160 | 991 |
| ACT | 84,597 | 20,809 | 1.33% | 1,119 | 1,014 |
Reach is not added across regions.
Video ad
Image / carousel ad

Image / carousel ad

Image / carousel ad
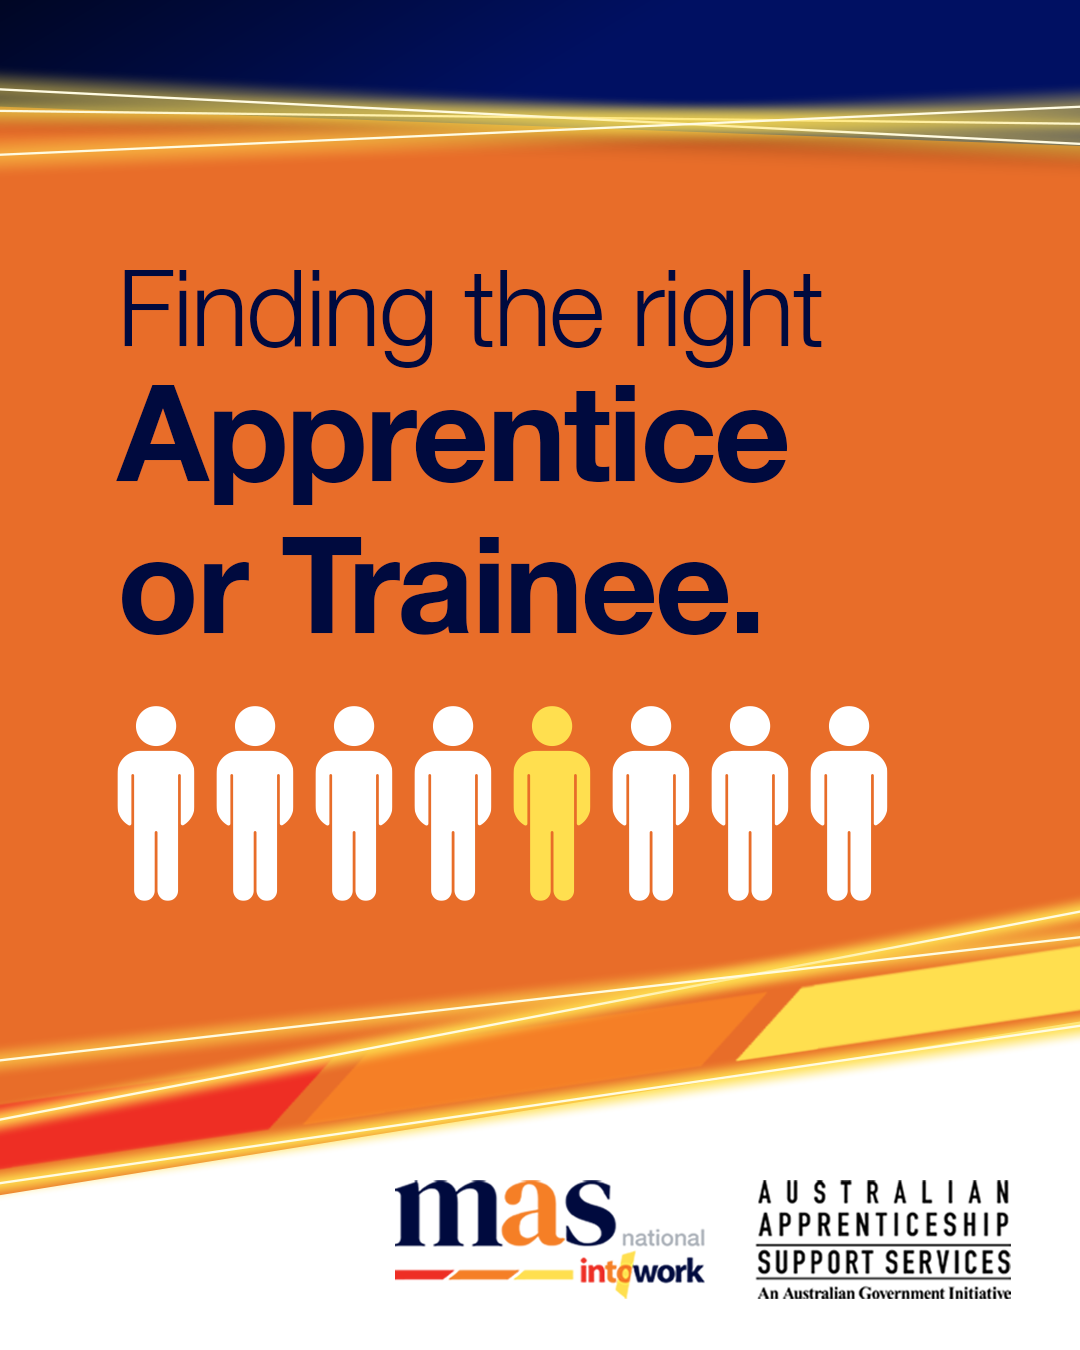
| Creative | Impressions | Link clicks | Landing page views |
|---|---|---|---|
| ACAP-03-NSW | 97,504 | 1,311 | 1,220 |
| ACAP-02-NSW | 35 | 0 | 0 |
| ACAP-01-NSW | 1,506 | 218 | 181 |
| ACAP-04-NSW | 596 | 23 | 19 |
| Creative | Impressions | Link clicks | Landing page views |
|---|---|---|---|
| ACAP-03-QLD | 95,310 | 1,260 | 1,171 |
| ACAP-01-QLD | 1,400 | 197 | 165 |
| ACAP-04-QLD | 438 | 14 | 12 |
| ACAP-02-QLD | 52 | 0 | 0 |
| Creative | Impressions | Link clicks | Landing page views |
|---|---|---|---|
| ACAP-01-SA | 3,730 | 450 | 373 |
| ACAP-02-SA | 27 | 1 | 1 |
| ACAP-03-SA | 79,185 | 829 | 760 |
| ACAP-04-SA | 66 | 1 | 1 |
| Creative | Impressions | Link clicks | Landing page views |
|---|---|---|---|
| ACAP-03-TAS | 71,408 | 620 | 545 |
| ACAP-04-TAS | 82 | 4 | 4 |
| ACAP-01-TAS | 6,137 | 536 | 442 |
| ACAP-02-TAS | 7 | 0 | 0 |
| Creative | Impressions | Link clicks | Landing page views |
|---|---|---|---|
| ACAP-03-ACT | 81,319 | 770 | 702 |
| ACAP-02-ACT | 8 | 0 | 0 |
| ACAP-01-ACT | 3,245 | 347 | 309 |
| ACAP-04-ACT | 25 | 2 | 3 |
Campaign: MAS - C - V2
Meta recorded 5 attributed pixel lead events. These are platform conversion events, not a verified count of unique enquiries.
| Region | Impressions | Reach | All-ad CTR | Link clicks | Landing page views |
|---|---|---|---|---|---|
| NSW | 23,492 | 8,940 | 1.25% | 121 | 102 |
| QLD | 32,616 | 8,411 | 0.98% | 141 | 105 |
| SA | 36,964 | 7,256 | 0.92% | 187 | 147 |
| ACT | 33,423 | 6,347 | 0.74% | 164 | 131 |
| TAS | 41,860 | 7,468 | 0.91% | 223 | 178 |
Reach is not added across regions.
Image / carousel ad

Image / carousel ad
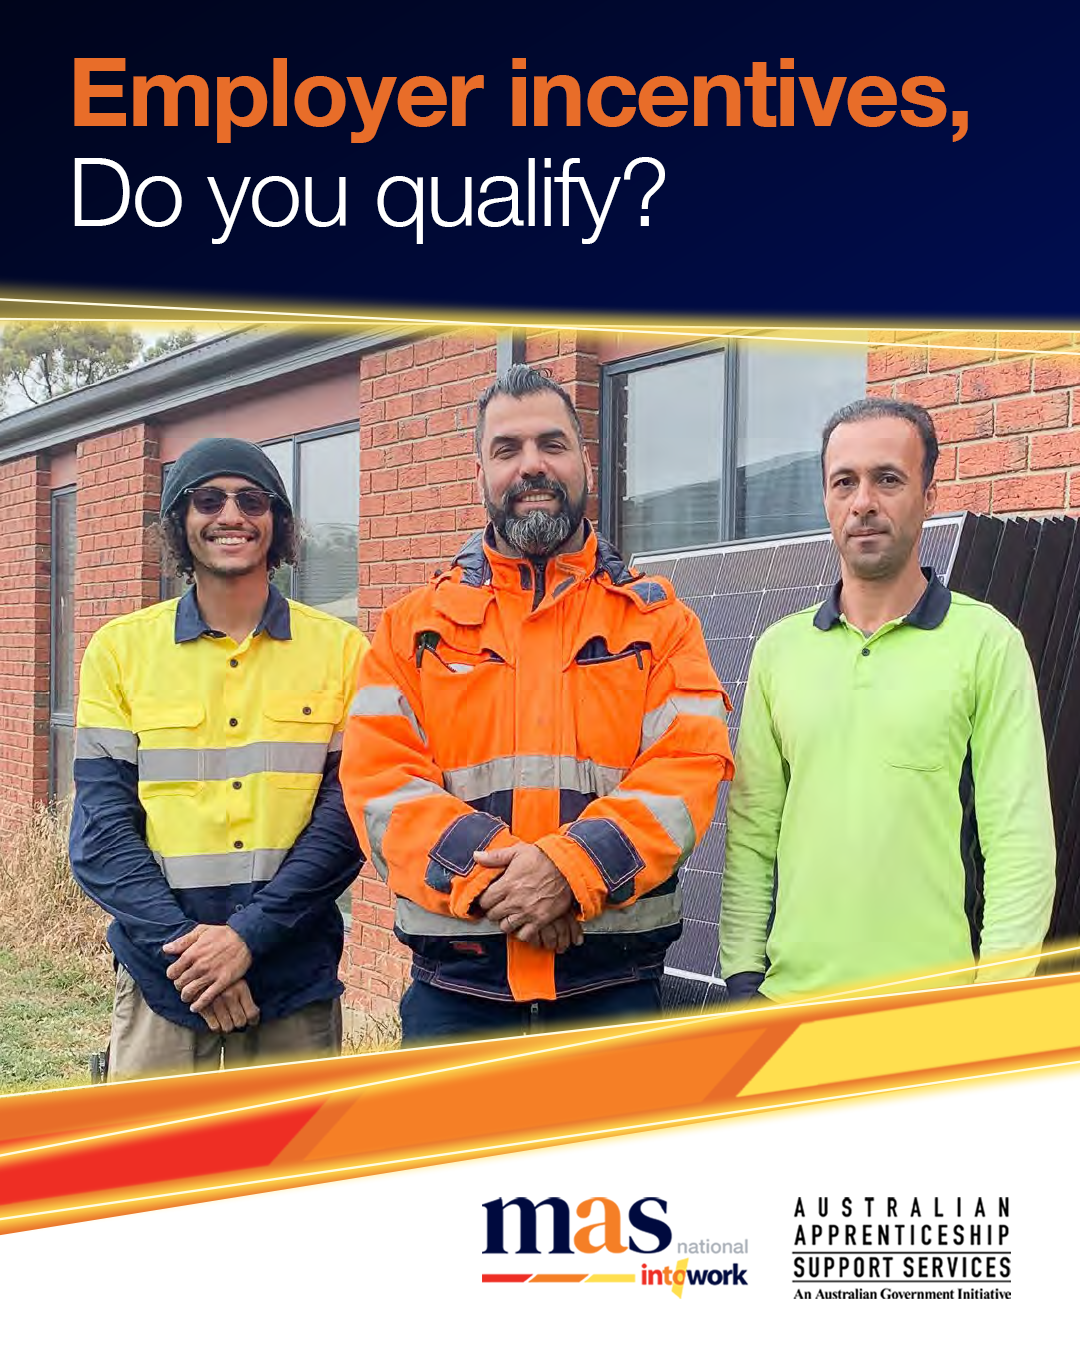
Image / carousel ad
| Creative | Impressions | Link clicks | Landing page views |
|---|---|---|---|
| MAS - C - 05 - NSW | 399 | 3 | 3 |
| MAS - C - 06 - NSW | 23,083 | 118 | 99 |
| MAS - C - 08 - NSW | 10 | 0 | 0 |
| Creative | Impressions | Link clicks | Landing page views |
|---|---|---|---|
| MAS - C - 06 - QLD | 32,336 | 137 | 102 |
| MAS - C - 05 - QLD | 239 | 4 | 3 |
| MAS - C - 08 - QLD | 41 | 0 | 0 |
| Creative | Impressions | Link clicks | Landing page views |
|---|---|---|---|
| MAS - C - 08 - SA | 176 | 0 | 0 |
| MAS - C - 06 - SA | 32,025 | 157 | 118 |
| MAS - C - 05 - SA | 4,763 | 30 | 29 |
| Creative | Impressions | Link clicks | Landing page views |
|---|---|---|---|
| MAS - C - 05 - TAS | 6,156 | 41 | 28 |
| MAS - C - 08 - TAS | 95 | 1 | 2 |
| MAS - C - 06 - TAS | 35,609 | 181 | 148 |
| Creative | Impressions | Link clicks | Landing page views |
|---|---|---|---|
| MAS - C - 08 - ACT | 114 | 1 | 0 |
| MAS - C - 05 - ACT | 5,585 | 35 | 28 |
| MAS - C - 06 - ACT | 27,723 | 128 | 103 |
Campaign: Mas - RMK - V2
| Region | Impressions | Reach | Link clicks |
|---|---|---|---|
| ACT | 1,294 | 355 | 4 |
| NSW | 10,762 | 2,898 | 54 |
| QLD | 8,952 | 2,549 | 43 |
| SA | 4,878 | 1,220 | 33 |
| TAS | 3,494 | 721 | 13 |
Reach is not added across regions.
Video ad
Video ad
Image / carousel ad

| Measure | Facebook and Instagram | LinkedIn shared campaign |
|---|---|---|
| Impressions | 35,222 | 436,451 |
| Reach | 14,240 | 99,053 (approx.) |
| Clicks | 1,486 link/profile clicks | 99 ad clicks |
| All-ad CTR | 5.22% | 0.02% |
| Frequency | 2.47 | 4.41 |
Facebook Page likes, Instagram follows and LinkedIn follows are distinct attributed actions, rather than net follower growth. The shared LinkedIn follower campaign is reported once.
Reach is not added across regions.
Image / carousel ad

Image / carousel ad
| Measure | ACAP employers | Allied Health providers |
|---|---|---|
| Impressions | 8,460 | 2,350 |
| Clicks | 1,109 | 181 |
| Click-through rate | 13.11% | 7.70% |
| Primary website form actions | 83 | 4 |
| Primary calls from ads | 48 | 39 |
| Primary conversion actions | 131 | 43 |
| Primary conversion rate | 11.81% | 23.76% |
Google conversion credit can be fractional and is rounded in headline counts. Lead Submit ALL covers website form events across the site, so campaign attribution does not confirm a form or service identity. ACAP also received 2 secondary Lead Submit MAH actions, excluded from primary totals.
| Search term | Impressions | Clicks | Conversion actions |
|---|---|---|---|
| mas national | 125 | 76 | 18.00 |
| mas apprenticeship | 14 | 12 | 4.00 |
| apprentice connect australia provider | 49 | 14 | 3.00 |
| mas national apprenticeship | 22 | 12 | 3.00 |
| mature age apprenticeship | 80 | 12 | 3.00 |
| megt apprenticeship | 52 | 10 | 3.00 |
| adms support | 7 | 5 | 2.00 |
| how to get a mature age apprenticeship | 7 | 4 | 2.00 |
| mature age apprenticeships | 5 | 2 | 2.00 |
| mas apprentice | 3 | 2 | 2.00 |
| apprenticeship connect provider | 2 | 1 | 2.00 |
| electrician apprenticeship | 121 | 8 | 2.00 |
| apprenticeship connect australia provider | 17 | 10 | 1.00 |
| Search term | Impressions | Clicks | Conversion actions |
|---|---|---|---|
| workforce australia | 333 | 14 | 3.00 |
| mas national apprenticeship | 40 | 16 | 2.00 |
| mas apprenticeships | 25 | 6 | 2.00 |
| workforce australia contact | 17 | 5 | 2.00 |
| mtc marrickville | 10 | 2 | 2.00 |
| etc strathpine | 16 | 2 | 2.00 |
| apm adelaide | 2 | 1 | 2.00 |
| apm chermside | 2 | 1 | 2.00 |
| busy ability north lakes | 5 | 2 | 1.00 |
| wise employment gosford | 5 | 2 | 1.00 |
| megt apprenticeship | 42 | 2 | 1.00 |
| verto bathurst | 3 | 2 | 1.00 |
| etc tuncurry | 2 | 2 | 1.00 |
| Campaign | Impressions | Approx. reach | Ad clicks | CTR | Campaign result |
|---|---|---|---|---|---|
| ACAP | LI | WV | Image | 235,137 | 22,739 | 6,042 | 2.57% | 6,042 landing page clicks |
| ACAP | LI | WV | Video | 266 | 104 | 9 | 3.38% | 9 landing page clicks |
| ACAP | LI | LG | 27,143 | 12,048 | 109 | 0.40% | 6 document downloads |
LinkedIn landing page clicks measure click-throughs, rather than confirmed website loads or enquiries. Reach is reported separately for each campaign and is not added.
Reported ad clicks. Demographic categories may overlap.
Reported ad clicks. Demographic categories may overlap.
Image ad

Image ad
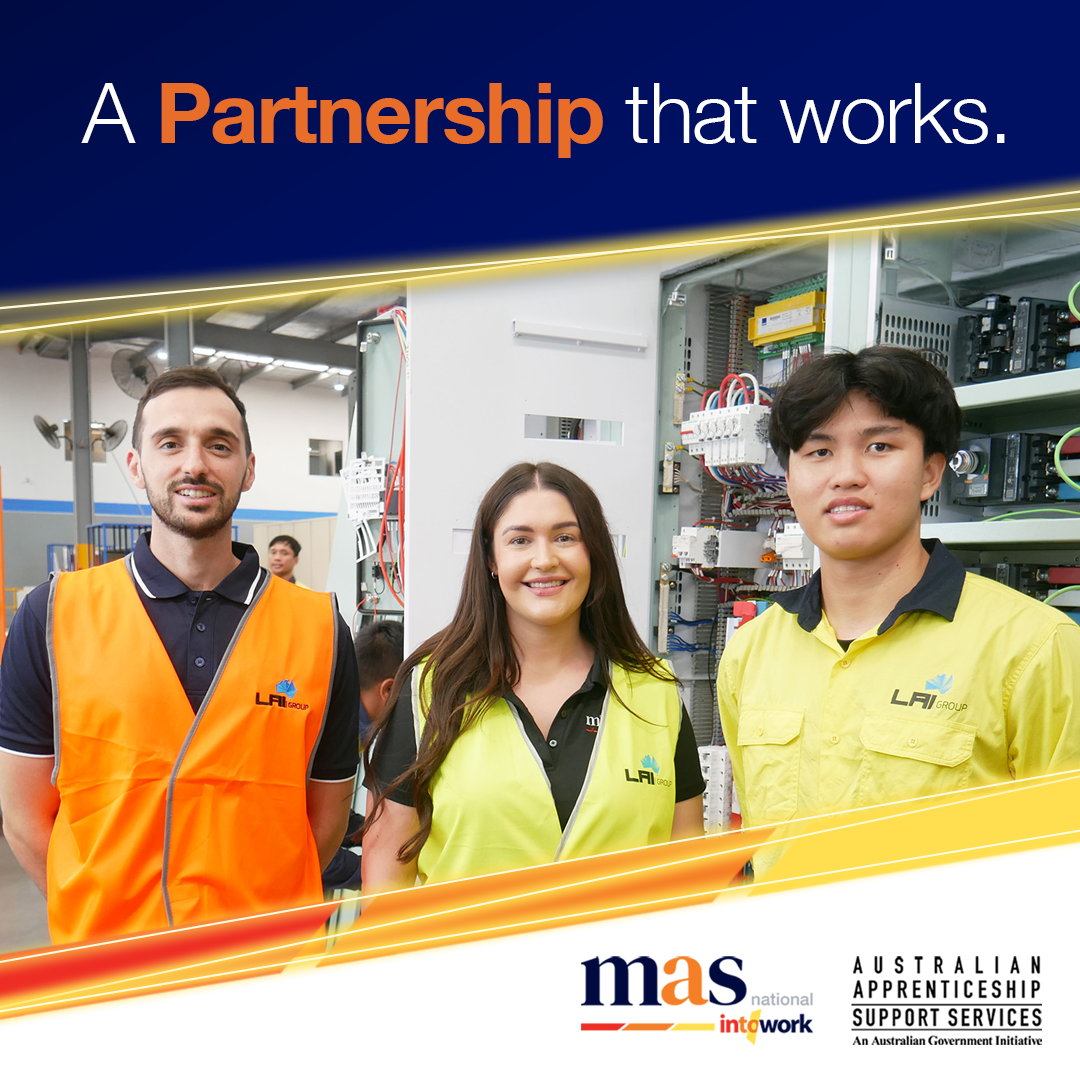
Document ad
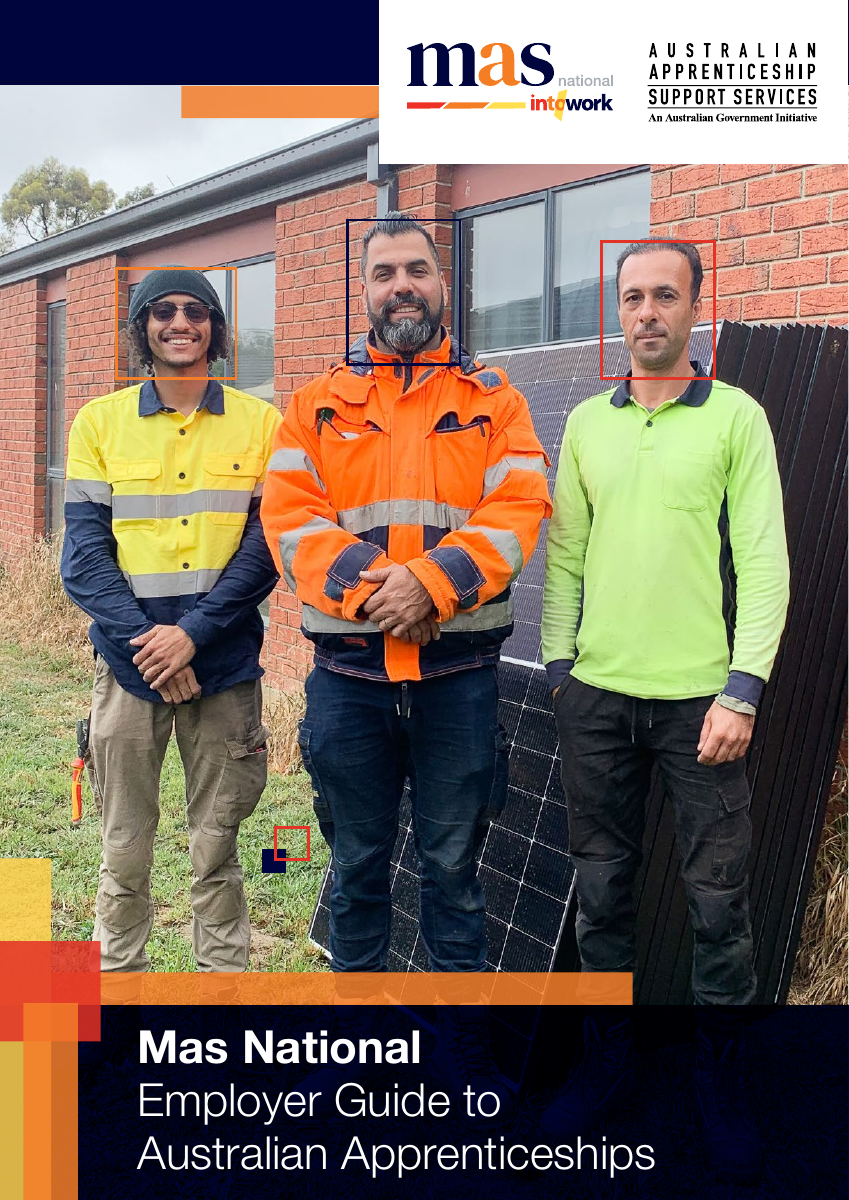
Video ad
| Campaign | Impressions | Approx. reach | Ad clicks | CTR | Campaign result |
|---|---|---|---|---|---|
| MAH | LI | WV | Images | 104,435 | 6,249 | 2,665 | 2.55% | 2,665 landing page clicks |
| MAH | LI | WV | Video | 33 | 15 | 2 | 6.06% | 2 landing page clicks |
| MAH | LI | QLD | 42,224 | 4,441 | 1,343 | 3.18% | 1,343 landing page clicks |
LinkedIn landing page clicks measure click-throughs, rather than confirmed website loads or enquiries. Reach is reported separately for each campaign and is not added.
Reported ad clicks. Demographic categories may overlap.
Reported ad clicks. Demographic categories may overlap.
Image ad
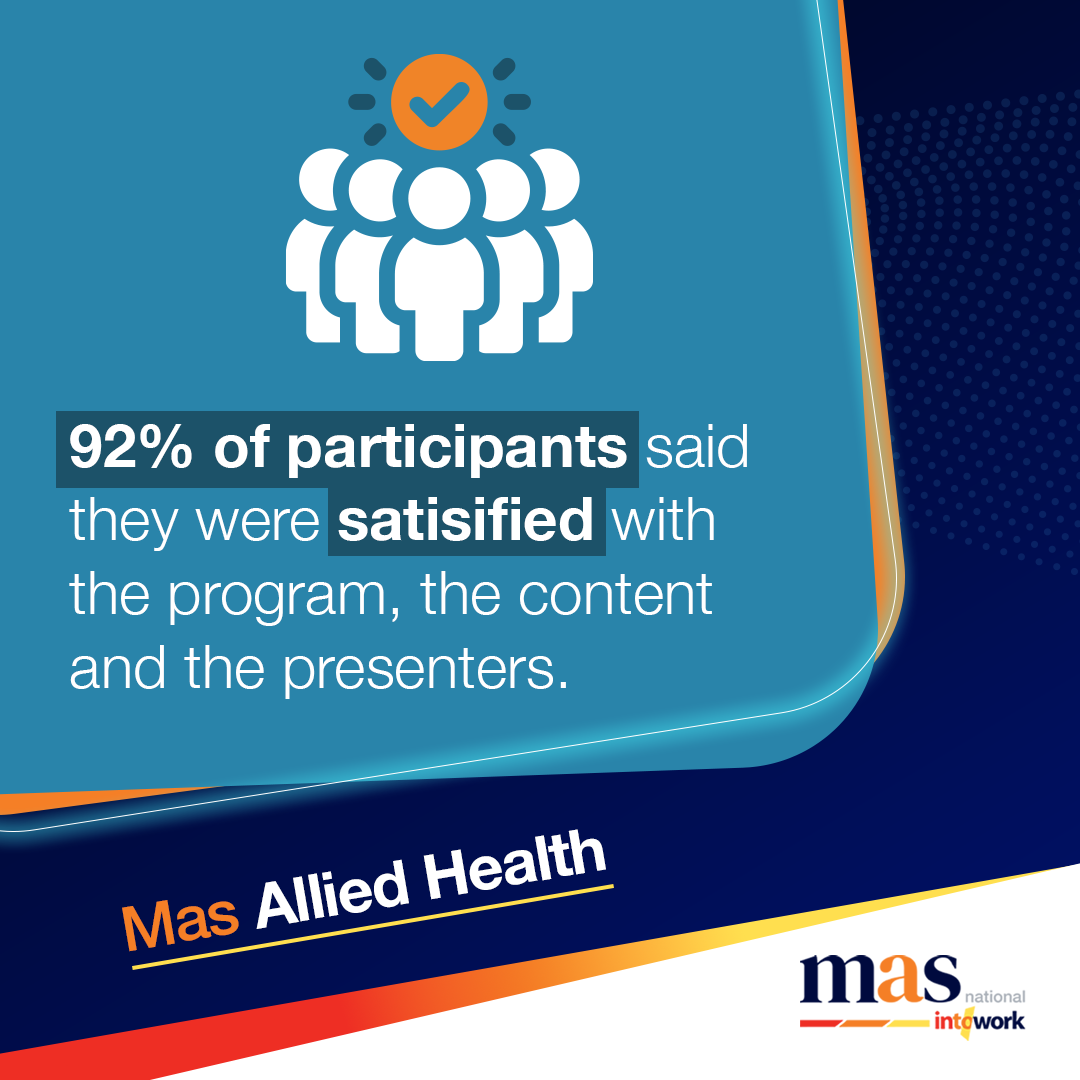
Video ad
Image ad
Image ad
Image ad
Video ad
Video ad
| Region | Page views | Engagement events | All clicks | Phone clicks | Form submissions |
|---|---|---|---|---|---|
| NSW | 12,326 | 3,985 | 566 | 89 | 86 |
| QLD | 8,926 | 2,883 | 417 | 30 | 63 |
| SA | 5,014 | 1,925 | 394 | 36 | 39 |
| TAS | 1,774 | 656 | 131 | 5 | 15 |
| ACT | 1,445 | 476 | 42 | 2 | 8 |
| Region | Contact Us | Sign Up Apprentice | Sign Up Apprentice Now |
|---|---|---|---|
| NSW | 80 | 4 | 4 |
| QLD | 61 | 1 | 3 |
| SA | 37 | 2 | 0 |
| TAS | 12 | 2 | 4 |
| ACT | 7 | 1 | 0 |
Website events cover all traffic on masnational.com.au. Event names can overlap and are not added to produce a lead total. The five regional rows do not represent all locations in the headline totals. Tracking consistency, duplicate controls and campaign attribution require separate verification.